Kubernetes Monitoring dashboard (with Prometheus)
This article describes how to download a specific dashboard pack. You can download dashboard packs from dashboards.squaredup.com and learn more about how dashboard packs work here: Dashboard Packs
Description
This dashboard visualizes the performance of a Kubernetes cluster by getting metrics from Prometheus using PromQL in the Web API and PowerShell tiles.
- Basic cluster information displayed in a grid
- Network traffic sent and received for the cluster
- CPU, memory and disk utilization for the cluster
- CPU, memory and disk used by each node in the cluster
The tiles on this dashboard automatically adjust the queries to Prometheus based of the page time frame being selected. The Rate and Step variables are handled in the PowerShell profile and can be amended as required.
How do I import and configure this dashboard?
Ensure you're using SquaredUp DS v5.4 or above.
Already a SquaredUp customer?
Get the latest version of SquaredUp DS for Azure
New to SquaredUp?
- Create a Web API provider to connect with Prometheus.
Use the following settings:TypeBasic AuthNamePrometheusNote: The name is case-sensitive and must be entered exactly like given here for the tiles to recognize the provider automatically. If you name it differently, you will need to select the provider manually for each tile on the dashboard.
URLURL of your Prometheus instance API endpoint, for examplehttps://<your-prometheus-url/api/v1/Username and passwordEnter the credentials for your Prometheus environmentIn SquaredUp DS navigate to the right-hand menu ☰ > system > Integrations
- Under Integrations click on Web API and choose either Simple, Basic Auth or OAuth depending on the API you are using.
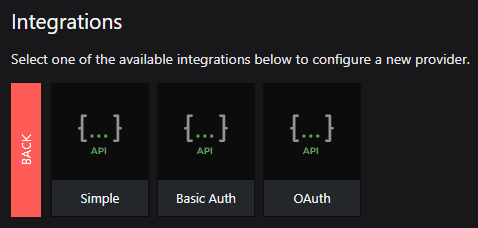 Note: When adding an OAuth provider you may get an message that the provider is not authorized if some of the provider configuration is incorrect (for example the username, password, secret etc), or if you use a proxy it could be that the proxy is not configured. See How to configure SquaredUp DS to use a proxy.Simple
No authentication, basic authentication (username and password in a header) or Windows authentication (configured automatically to use the application pool identity account).
Basic authBasic authentication. Your specified username and password will be Base64 encoded automatically.
OAuthToken-based authentication according to the OAuth 2.0 standard. Many APIs use OAuth 2.0 for authorization, and will require an OAuth provider to include the additional information about how to authorize against the service.
- Complete the provider fields, using your API provider's online documentation as a guide.
ignore invalid ssl: Turn the on/off switch to on if you are using a self-signed certificate.
default headers headers sent with all requests using this provider, for example the API token in the format the API requires.
url parameters url parameters sent with all requests using this provider. For example, a query parameter that is always used can be added here in the provider to save adding it to every dashboard configuration.
- You are now ready to use this provider in a Web API tile (see How to use the Web API tile).
- Create a PowerShell profile in SquaredUp DS with the following settings: NamePrometheus
Note: The name is case-sensitive and must be entered exactly as given here for the tiles to recognize the profile automatically. If you name it differently, you will need to select the profile manually for each tile on the dashboard.
DescriptionSets the Prometheus API endpoint, changes step and rate values based on the timeframe of the page, and gets the page timeframe start and end.ScriptCopy and paste the script below, replacing<your-prometheus-url>with your Prometheus instance API endpoint. Modify the PowerShell profile to handle the authentication method required by your deployment of Prometheus.# Set the end point of the Prometheus API endpoint $uri = "https://<your-prometheus-url>/api/v1/query_range" # Changes step and rate values based on the timeframe of the page. switch ($timeFrame) { "last1Hour" { $step = '60'; $timeago = -1; $rate = '2m' } "last12Hours" { $step = '600'; $timeago = -12; $rate = '30m' } "last24Hours" { $step = '900'; $timeago = -24; $rate = '1h' } "last7Days" { $step = '1200'; $timeago = -168; $rate = '6h' } "last30Days" { $step = '1800'; $timeago = -720; $rate = '1d' } "last3Months" { $step = '7200'; $timeago = -2160; $rate = '1d' } "last6Months" { $step = '10800'; $timeago = -4320; $rate = '7d' } "last12Months" { $step = '21600'; $timeago = -8640; $rate = '7d' } } # Get the page timeframe start and end $end = Get-Date -Date (Get-Date) -UFormat %s $start = Get-Date -Date ((Get-Date).AddHours($timeago)) -UFormat %s- From the top right hand menu ☰ click system.
- Go to the PowerShell tab.
- Click add new profile.
- Enter a name and a description for the new profile.
- Enter the profile script.
- Click add profile.
The profile is now saved and can be used in a PowerShell tile.
For more help creating a PowerShell profile see How to use the PowerShell tile
Download and import this dashboard pack.
- Download the dashboard pack zip file for the dashboard pack you wish to import.
There may be additional steps before or after the import to get the dashboard working in your environment.
- In DS for Azure go to the top right hand menu ☰ > Import Dashboard Packs and drag the zip file into the Manual Import box.
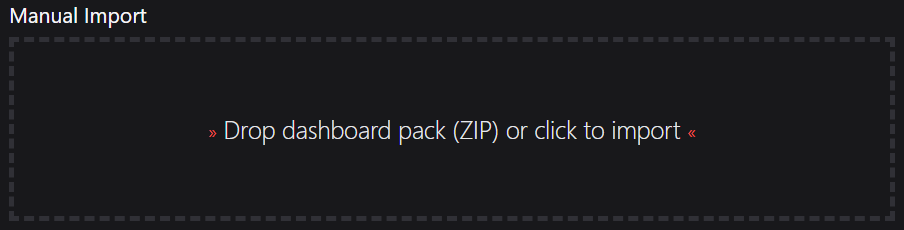
- The dashboard pack is imported and if the pack contains top-level dashboards, these will automatically appear in the navigation bar, usually in a folder called 'Community Dashboards' for dashboard packs from the SquaredUp Community.
- Carry out any additional steps required to make the dashboard work in your environment. These steps will be described on the download page for each dashboard. For example, you may need to create the correctly named Web API provider, create a PowerShell profile, or edit tile scopes.
- Edit the imported dashboard as required.
- Download the dashboard pack zip file for the dashboard pack you wish to import.