This article describes how to download a specific dashboard pack. You can download dashboard packs from dashboards.squaredup.com and learn more about how dashboard packs work here: Dashboard Packs
This dashboard gives an overview of Pingdom checks using PowerShell scripts against the Pingdom API
Monitor Health - Status block tile showcasing health and last response time
Monitor Status - Donut tile summarizing checks by status
Monitor by Type - Donut tile summarizing checks by check type
Monitor Last Response Time - Scalar tile values for single checks. Your chosen Pingdom check name should be added into the quotes in the tile script section: $checkName = '' for example $checkName = 'website'.
Last Response Time - Bar of all checks' last response time
Multiple Response Times - Line graph of two checks (easily adapted to include more than two checks) - Your chosen Pingdom check ID should be added into the quotes in the tile script section: $checkId1 = '' and $checkId2 = '' for example, $checkId1 = '1234567'.
Single Response Time - Line graph for single check -Your chosen Pingdom check ID should be added to the tile script section in the quotes: $checkId1 = ''for example, $checkId1 = '1234567'.
Monitors Detail - Full check output (some returned data hidden - use grid columns > show hidden columns in the tile to view all)
Pingdom check ID's and names are shown in the PowerShell grid tile titled Monitors Details at the bottom of the dashboard.
Create a PowerShell profile in SquaredUp DS with the following settings:
Name
Pingdom
Note: The name is case-sensitive and must be entered exactly as given here for the tiles to recognize the profile automatically. If you name it differently, you will need to select the profile manually for each tile on the dashboard.
Description
Sets the Pingdom API endpoint, changes step and rate values based on the timeframe of the page, and gets the page timeframe start and end.
Script
Copy and paste the script below. Modify the PowerShell profile to replace ***TOKEN GOES HERE*** with your Pingdom API token without the asterix.
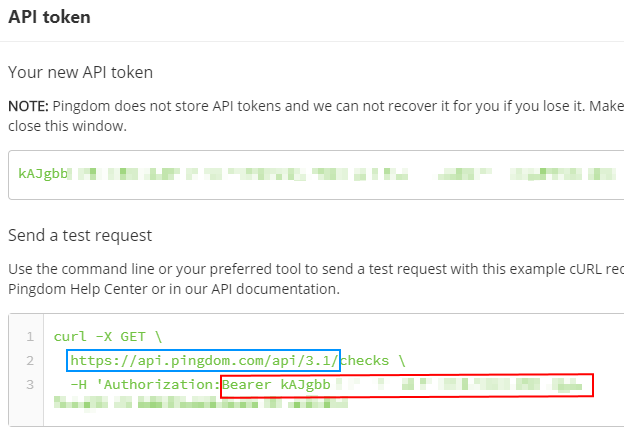
You can create an API key (token) by logging in to Pingdom > Settings > Pingdom API > Add API token
Enter a Name, leave the Access Level set to Read access and click Generate token.
Copy the API token from Pingdom before closing the window:
Download and import this dashboard pack.
Download the dashboard pack zip file for the dashboard pack you wish to import.
There may be additional steps before or after the import to get the dashboard working in your environment.
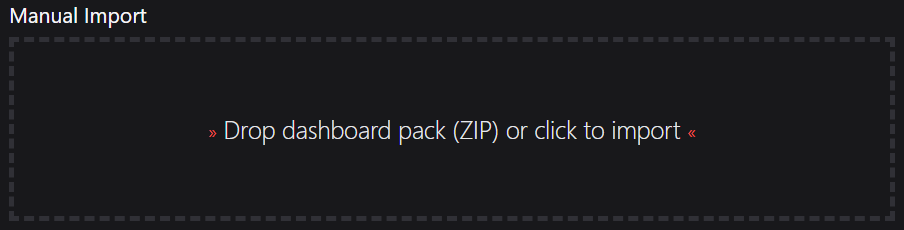
In DS for Azure go to the top right hand menu ☰ > Import Dashboard Packs and drag the zip file into the Manual Import box.
The dashboard pack is imported and if the pack contains top-level dashboards, these will automatically appear in the navigation bar, usually in a folder called 'Community Dashboards' for dashboard packs from the SquaredUp Community.
Carry out any additional steps required to make the dashboard work in your environment. These steps will be described on the download page for each dashboard. For example, you may need to create the correctly named Web API provider, create a PowerShell profile, or edit tile scopes.
Edit the imported dashboard as required.
Finally you need to edit the dashboard to enter the Pingdom check IDs and names for the checks you wish to display. Each tile that needs editing has a subheading showing what is needed. Copy the checks ID or name you want from the PowerShell grid tile titled Monitors Details at the bottom of the dashboard. If you prefer, then you can find the check IDs and names in Pingdom as described below.
Edit each tile and enter the required checks ID or name into the script section of the tile configuration. So it looks like this, but with your own check IDs: