Matrix tile
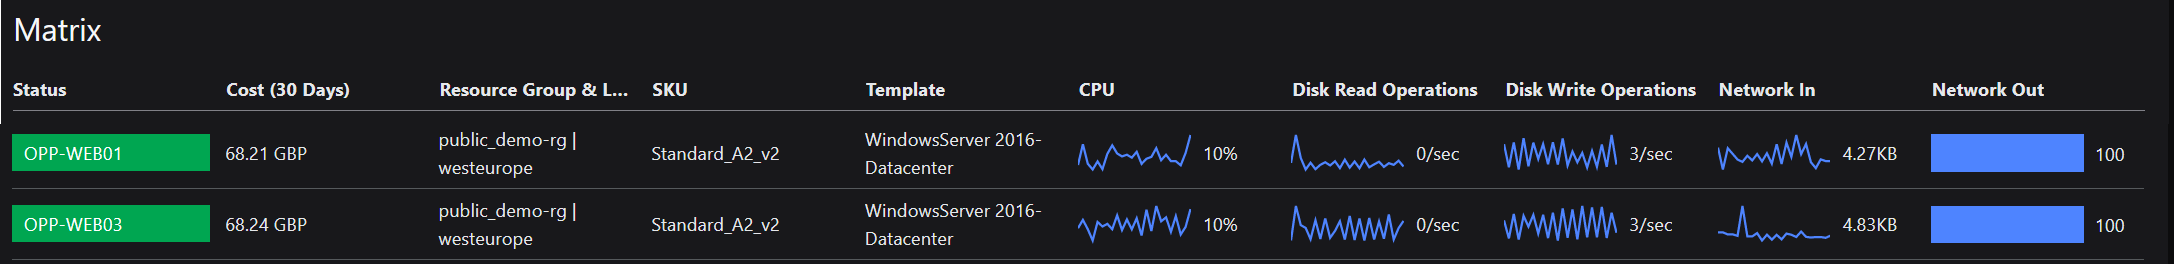
The Matrix tile shows health state, performance metrics and other information for a list of monitored resources.
Tip: Too add more context to the data your displaying, you can also show it on an image background. For example, you can use a map as a background and show metrics for your servers on the map based on their location. For that, you need to use the Surface tile (How to use the Surface tile).
How does the Matrix tile work?
The Matrix tile works by using a row perspective to show a row of data for each of the resources returned by the scope.
A row perspective can display health state, performance metrics and other information for each resource. They work in a similar way to dashboard perspectives in that they are stored in dashboard packs, they use a match criteria that defines which resource they apply to, and they have a rank that specifies which row perspective should be displayed when multiple row perspectives match. A row perspective is made up of 'cell tiles' of various types, such as Status, Sparkline, Bar, Health State History etc.
The same row perspective is used for all the resources returned by the scope.
What if there is more than one row perspective common to the resources?
If there is more than one common row perspective, then the highest ranked row perspective is used to show data for all the resources.
What if there is not a row perspective common to the resources?
You can manually select one of the row perspectives shown, but if this row perspective does not apply to some of the resources then those rows will be blank.
Can I change what information is shown?
You can edit a row perspective on a per tile one off basis, for example to remove some elements if some data is missing, by choosing custom columns, see Custom - edit columns in the JSON editor. These edits will only apply to this tile on this dashboard.
Can I create new row perspectives?
To create a new row perspective to be used by more than one tile, see How to create and modify row perspectives. These row perspectives can then be used in other tiles.
How to configure a Matrix tile
- Add a new tile to a dashboard or perspective and choose Resources > Matrix tile.
- Scope:
Configure the scope to define the resources you want to show.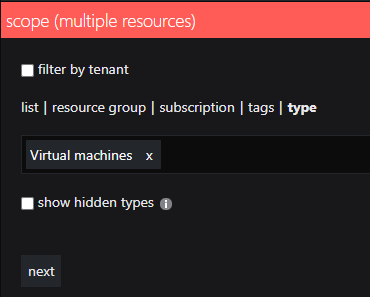
Tip: If you experience any problems with scoping tiles, you'll find FAQs and help in the article How to scope tiles.
Note: By default, results are shown across all subscriptions (unless the subscription option is chosen to specify only one or more subscriptions).
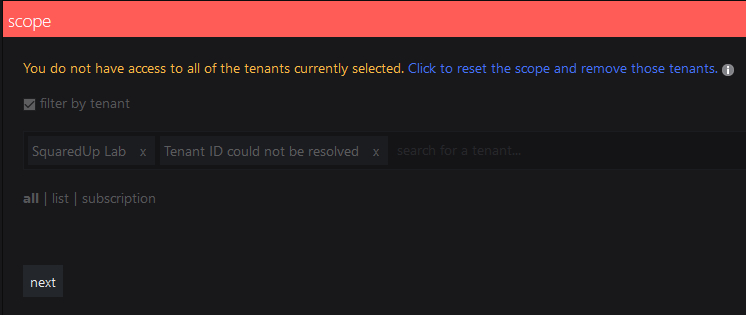
Filter by tenantBy default results are shown across all tenants. In SquaredUp DS 4.7 and above a user who has access to multiple tenants will see a filter by tenant option.In a multi-tenant environment a user who does not have access to all tenants will see this message if they attempt to edit a scope containing tenants that they do not have access to. This may be because:
- One SquaredUp DS admin has added a tile scoped to tenants that other SquaredUp DS admins do not have permissions to.
- The customer/tenant is no longer serviced by this Customer Service Provider (CSP), so the tenant has been permanently removed for all SquaredUp DS admins.
Symptoms
A tile scope shows:
"You do not have access to all of the tenants currently selected. Click here to reset which will remove those tenants from the scope."
Tenants the user does not have access to show as:
"Tenant ID could not be resolved"
Procedure
The message warns users that they do not have permissions to all the tenants in the scope.
If the user chooses to reset and therefore edit the scope then the tenants that they do not have access to will be removed. If saved this scope will also have those tenants removed for users who do have access to them.
It is not possible for the user to edit the scope without those tenants being removed from the scope.
Where a tenant has been removed permanently you may wish to reset the scope to remove the unresolvable tenants.
ListList allows you to select several individual items to show.You can add multiple items. To remove an item click the x to the right of its name.Tip: Start typing and after two characters you'll see suggestions that match the name appear.Note: It depends on the tile what happens when you select more than one item. For example, when you select two virtual machines for a Status tile, you'll see the status of those VMs individually. When you select two virtual machines for a Cost Management tile, you'll see the cost for the two VMs added together.Resource groupSelect one or more resource groups.Filter by type:Tick filter by type to only show resources of a particular type within the chosen resource group.SubscriptionSelect one or more subscriptions from the dropdown box if you wish to restrict results to only one or more subscriptions. When this is not used results are shown across all subscriptions.Filter by type:Tick filter by type to only show resources of a particular type within the chosen subscription.TagsSelect items with a particular tag. Add the tag name and the tag value you want to use to search for. If you select multiple tags, the search automatically 'ANDs' the tags which means the scope only contains items which are tagged with all the tags listed.Filter by type:Tick filter by type to only show resources of a particular type within the chosen tag(s).TypeScope type can be used to show all resources of a particular type, for example all databases across all subscriptions, by typingdatabasesand selectingSQL databases.Show hidden typesThis works in the same way as the Show hidden types option in the Azure portal.Hidden types include some ancillary resources which are created/managed by Azure infrastructure. It might be useful to display these resources when cleaning up your resource groups or subscriptions.Note: If you never used a perspective, you should read Working with perspectives before scoping tiles on perspectives.
The power of perspectives is that tiles on a perspective can use a dynamic scope. A dynamic scope considers the currently viewed resource. A dynamic scope consists of two different states:
- the configuration of the scope in the tile (for example, "consider child objects of type logical disk for the currently viewed object")
- the actual resolved scope that depends on which resource you are currently viewing ("this object has 5 child objects of type logical disk")
After configuring the dynamic scope once in the tile, you'll get different results depending how the scope is resolved on the different resources you are viewing.
On perspectives, you can scope tiles to:
this resource
(only on perspectives for resources)The tile's scope will be the resolved to the resource that is currently viewed.child resources
(only on perspectives for resource groups and subscriptions)When you select this option, the scope of the tile will be resolved to all resources that are in the group or subscription that is currently viewed.If you want to narrow the scope down to a specific type of resource in the group or subscription, you can filter for one specific type of resource.other resourcesGives you the normal, non-dynamic scope options you are used to when scoping tiles on dashboards. This means the tile will not dynamically adapt it's content to the currently viewed resource, it will always show data for the static resource picked here.
Since the power of perspectives is that their tiles can show data for different resources depending on what resource is currently being viewed, you should only select this option when you are sure that there is no relationship between the desired scope and the currently viewed resource.
- Columns:
By default the Matrix tile is set to use dynamic columns:
Dynamic - using row perspectives
In dynamic mode the columns are automatically populated by a row perspective that is useful for your scope. Depending on your scope, there might be additional predefined row perspectives for you to choose from. The row perspective determines the columns you are seeing in the matrix.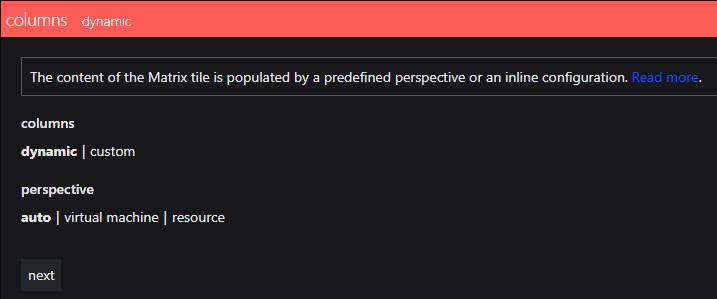
Custom - edit columns in the JSON editor
Alternatively, you can select custom columns, where you can modify the predefined row perspective in a JSON editor. When you switch from dynamic to custom, the row perspective you chose under dynamic will already be inserted in the JSON editor as a template. Here you can edit the columns, add new ones or change their order.
You can make simple edits by cutting and pasting code snippets to change their order or simply deleting the code block for a column you don't need.
Tip: If you change the configuration by using custom columns, you can save those settings as a row perspective to make them available here in the future (How to create and modify row perspectives).
If you want to insert new columns, use the following reference for each cell type:
Code snippets for cell types:
Displays the health state of a resource and its display name.
Configuration
Example:
{
	"title": "State",
	"_type": "celltile/azure-status",
	"config": {
		"display": {
			"showStatusIcon": false
		}
	}
}
Type:
"celltile/azure-status"Display Properties:
"showStatusIcon":truewill show the status icon indicator.falsewill hide the icon. The default value istrue."labelTemplate"a mustache template to render as custom label.Source Properties: None

Displays the health state of an resource as simple colored block, with the color indicating the health state.
Configuration Example:
{
	"title": "Status",
	"_type": "celltile/azure-status-block",
	"config": {
		"display": {
			"fullWidth": true
		}
	}
}
Type:
celltile/azure-status-blockDisplay Properties:
"fullWidth":truethe block will fill the available column width,falsewill use a fixed width. The default value isfalse."labelTemplate"a mustache template to render as custom label.Source Properties: None
Renders a custom mustache template and displays the result in the cell.
Configuration Example:
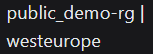
{
	"title": "Resource Group & Location",
	"_type": "celltile/text",
	"config": {
		"display": {
			"contentTemplate": "{{resourceGroup}} | {{location}}"
		}
	}
}
Type:
celltile/textDisplay Properties:
"contentTemplate"a mustache template to render. Can contain any valid template, the context resource for the current row will be provided as the template context.Example content templates:
- Display the Resource group and Location:
"{{resourceGroup}} | {{location}}" - Display the SKU for a virtual machine:
"{{properties.hardwareProfile.vmSize}}" - Display the Template
"{{#if properties.storageProfile.imageReference}}{{properties.storageProfile.imageReference.offer}} {{properties.storageProfile.imageReference.sku}}{{else}}{{properties.storageProfile.osDisk.osType}}{{/if}}"
Source Properties: None

Shows the cost of the resource based on the timeframe selected.
Configuration Example:
{
      	"title": "Cost (30 Days)",
		"_type": "celltile/azure-cost",
		"config": {
			"source": {
				"timeframe": {
					"range": "last30days",
					"type": "fixed"
				}
			}
		}
	}
Type:
celltile/azure-costDisplay Properties: None
Source Properties:
"timeframe"Timeframe consists of two properties one for the range and the other for the type. Acceptable range values are:"last7days","last30days","last3months","last6months","last12months".Default timeframe:
By default, all cell tiles in the Matrix tile adapt to the page timeframe.
The page timeframe is the timeframe setting a dashboard or perspective is currently using. These timeframes are all relative to the current time, for example 7 days ago until now. When a user changes the page timeframe, all tiles that have use page timeframe set will adapt to the new timeframe. (Tiles that do not have use page timeframe set (i.e. are set to specific timeframe or custom timeframe) are not affected and won't change.)
Setting a specific timeframe:
You can set a fixed timeframe for cells by adding
timeframeas asourceproperty:"source": { "timeframe": { "type": "fixed", "range": "last24hours" },Properties
rangelast1hour,last12hours,last24hours,last7days,last30days,last3months,allDurations of 2, 4, 6 hours, or 14 days can NOT be used in the above format.The custom option can be used to set timeframes using ISO 8601 format
SquaredUp DS does not support the week notation.
Note: You need to make sure that the data source supports the timeframe you set (for example the Cost cell tile does not work with 1 hour or 12 hour since the timeframe is too short for the API to get data).typefixed= use fixedrangevalueinherit= use page timeframe (default)
Displays a bar graph that visualizes both a number and the resulting bar width based on the number value.
Configuration Example:
{ "title": "Network In (KB)", "_type": "celltile/azure-bar", "config": { "display": { "valueTemplate": "{{value ? (value/1024).toFixed(2) : '0'}}" }, "source": { "metric": "Network In" } } }Type:
celltile/azure-barDisplay Properties:
"valueTemplate"mustache template to execute that processes the"value"to be rendered as the bar graph label. By default this template is"{{value ? Math.min(value, 100) : ''}}""height"in pixels of the bar visualization.Source Properties:
The
"metric"properties should be set to the appropriate metric to be retrieved by that data-source.Example showing network out usage with the value keeping only two decimals formatted in valueTemplate:
{ "title": "Network Out (KB)", "_type": "celltile/azure-bar", "config": { "display": { "valueTemplate": "{{value ? (value/1024).toFixed(2) : '0'}}" }, "source": { "metric": "Network Out" } } }Default timeframe:
By default, all cell tiles in the Matrix tile adapt to the page timeframe.
The page timeframe is the timeframe setting a dashboard or perspective is currently using. These timeframes are all relative to the current time, for example 7 days ago until now. When a user changes the page timeframe, all tiles that have use page timeframe set will adapt to the new timeframe. (Tiles that do not have use page timeframe set (i.e. are set to specific timeframe or custom timeframe) are not affected and won't change.)
Setting a specific timeframe:
You can set a fixed timeframe for cells by adding
timeframeas asourceproperty:"source": { "timeframe": { "type": "fixed", "range": "last24hours" },Properties
rangelast1hour,last12hours,last24hours,last7days,last30days,last3months,allDurations of 2, 4, 6 hours, or 14 days can NOT be used in the above format.The custom option can be used to set timeframes using ISO 8601 format
SquaredUp DS does not support the week notation.
Note: You need to make sure that the data source supports the timeframe you set (for example the Cost cell tile does not work with 1 hour or 12 hour since the timeframe is too short for the API to get data).typefixed= use fixedrangevalueinherit= use page timeframe (default)Timeframes:
Displays a sparkline graph visualization of Azure Monitor metrics data over time for a given resource.
Configuration Example:
{ "title": "CPU", "_type": "celltile/azure-sparkline", "config": { "source": { "metric": "Percentage CPU" } } }Type:
celltile/azure-sparklineDisplay Properties:
"height"in pixels of the graph."width"in pixels of the graph."verticalMargin"the margin above and below the graph."labelTemplate"a mustache template to render as the label, context is latest performance value as a number value."fill"if set to true it will fill the area under the sparkline to display in a line-graph style.Source Properties:
The
"metric"properties should be set to the appropriate metric to be retrieved by that data-source.Example metrics:
`"metric": "Disk Read Operations/sec" - display the disk read operation speed.
`"metric": "Percentage CPU" - Shows the CPU usage of the resource.
Default timeframe:
By default, all cell tiles in the Matrix tile adapt to the page timeframe.
The page timeframe is the timeframe setting a dashboard or perspective is currently using. These timeframes are all relative to the current time, for example 7 days ago until now. When a user changes the page timeframe, all tiles that have use page timeframe set will adapt to the new timeframe. (Tiles that do not have use page timeframe set (i.e. are set to specific timeframe or custom timeframe) are not affected and won't change.)
Setting a specific timeframe:
You can set a fixed timeframe for cells by adding
timeframeas asourceproperty:"source": { "timeframe": { "type": "fixed", "range": "last24hours" },Properties
rangelast1hour,last12hours,last24hours,last7days,last30days,last3months,allDurations of 2, 4, 6 hours, or 14 days can NOT be used in the above format.The custom option can be used to set timeframes using ISO 8601 format
SquaredUp DS does not support the week notation.
Note: You need to make sure that the data source supports the timeframe you set (for example the Cost cell tile does not work with 1 hour or 12 hour since the timeframe is too short for the API to get data).typefixed= use fixedrangevalueinherit= use page timeframe (default)
By default, all cell tiles in the Matrix tile adapt to the page timeframe.The page timeframe is the timeframe setting a dashboard or perspective is currently using. These timeframes are all relative to the current time, for example 7 days ago until now. When a user changes the page timeframe, all tiles that have use page timeframe set will adapt to the new timeframe. (Tiles that do not have use page timeframe set (i.e. are set to specific timeframe or custom timeframe) are not affected and won't change.)
A specific timeframe can only be set in the cell types Bar, Cost, and Performance as Sparkline.
You can set a fixed timeframe for cells by adding
timeframeas asourceproperty:"source": { "timeframe": { "type": "fixed", "range": "last24hours" },Properties
rangelast1hour,last12hours,last24hours,last7days,last30days,last3months,allDurations of 2, 4, 6 hours, or 14 days can NOT be used in the above format.The custom option can be used to set timeframes using ISO 8601 format
SquaredUp DS does not support the week notation.
Note: You need to make sure that the data source supports the timeframe you set (for example the Cost cell tile does not work with 1 hour or 12 hour since the timeframe is too short for the API to get data).typefixed= use fixedrangevalueinherit= use page timeframe (default) - Display the Resource group and Location:
- Display:
Size:
Change the setting from default to large when you want to use the matrix tile on a wall monitor. Icons and fonts will be larger and better to read.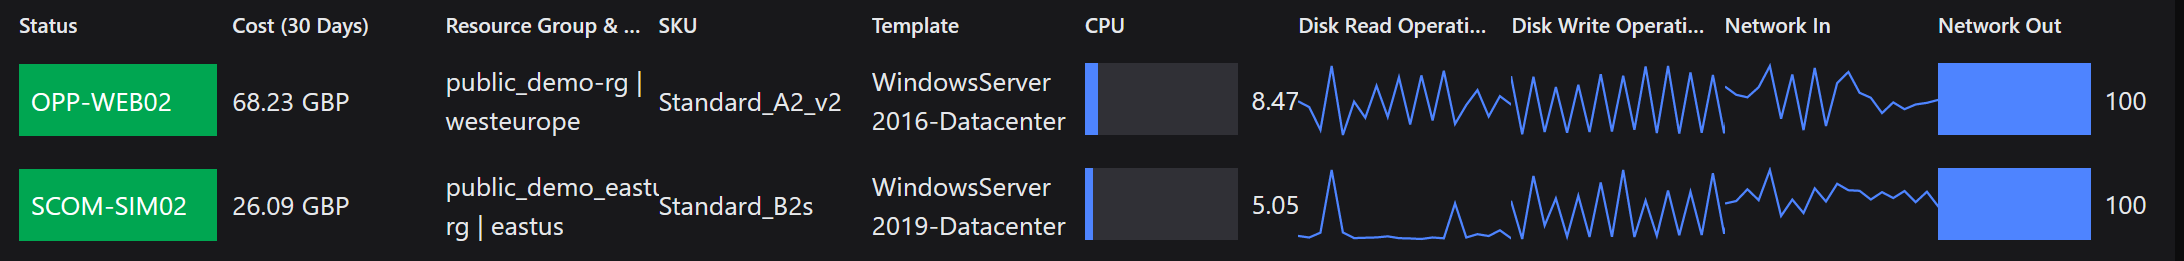
- Click done to save the tile.
Reference
Cell tile definitions
Displays the health state of a resource and its display name.
Configuration
Example:
{
"title": "State",
"_type": "celltile/azure-status",
"config": {
"display": {
"showStatusIcon": false
}
}
}Type:"celltile/ azure-status"
Display Properties:
"showStatusIcon": true will show the status icon indicator. false will hide the icon. The default value is true.
"labelTemplate" a mustache template to render as custom label.
Source Properties: None
Displays the health state of an resource as simple colored block, with the color indicating the health state.
Configuration Example:
{
"title": "Status",
"_type": "celltile/azure-status-block",
"config": {
"display": {
"fullWidth": true
}
}
}Type:celltile/azure-status-block
Display Properties:
"fullWidth": true the block will fill the available column width, false will use a fixed width. The default value is false.
"labelTemplate" a mustache template to render as custom label.
Source Properties: None
Renders a custom mustache template and displays the result in the cell.
Configuration Example:
{
"title": "Resource Group & Location",
"_type": "celltile/text",
"config": {
"display": {
"contentTemplate": "{{resourceGroup}} | {{location}}"
}
}
}Type:celltile/text
Display Properties:
"contentTemplate" a mustache template to render. Can contain any valid template, the context resource for the current row will be provided as the template context.
Example content templates:
- Display the Resource group and Location:
"{{resourceGroup}} | {{location}}" - Display the SKU for a virtual machine:
"{{properties.hardwareProfile.vmSize}}" - Display the Template
"{{#if properties.storageProfile.imageReference}}{{properties.storageProfile.imageReference.offer}} {{properties.storageProfile.imageReference.sku}}{{else}}{{properties.storageProfile.osDisk.osType}}{{/if}}"
Source Properties: None
Shows the cost of the resource based on the timeframe selected.
Configuration Example:
{
"title": "Cost (30 Days)",
"_type": "celltile/azure-cost",
"config": {
"source": {
"timeframe": {
"range": "last30days",
"type": "fixed"
}
}
}
}Type:celltile/azure-cost
Display Properties: None
Source Properties:
"timeframe" Timeframe consists of two properties one for the range and the other for the type. Acceptable range values are: "last7days", "last30days", "last3months", "last6months", "last12months".
Default timeframe:
By default, all cell tiles in the Matrix tile adapt to the page timeframe.
The page timeframe is the timeframe setting a dashboard or perspective is currently using. These timeframes are all relative to the current time, for example 7 days ago until now. When a user changes the page timeframe, all tiles that have use page timeframe set will adapt to the new timeframe. (Tiles that do not have use page timeframe set (i.e. are set to specific timeframe or custom timeframe) are not affected and won't change.)
Setting a specific timeframe:
You can set a fixed timeframe for cells by adding timeframe as a source property:
"source": {
			"timeframe": {
				"type": "fixed",
				"range": "last24hours"
			},
Properties
range |
Durations of 2, 4, 6 hours, or 14 days can NOT be used in the above format. The custom option can be used to set timeframes using ISO 8601 format SquaredUp DS does not support the week notation. Note: You need to make sure that the data source supports the timeframe you set (for example the Cost cell tile does not work with 1 hour or 12 hour since the timeframe is too short for the API to get data). |
type | fixed = use fixed range valueinherit = use page timeframe (default) |
Displays a bar graph that visualizes both a number and the resulting bar width based on the number value.
Configuration Example:
{
    "title": "Network In (KB)",
	"_type": "celltile/azure-bar",
	"config": {
		"display": {
			"valueTemplate": "{{value ? (value/1024).toFixed(2) : '0'}}"
		},
		"source": {
			"metric": "Network In"
		}
	}
}Type:celltile/ azure-bar
Display Properties:
"valueTemplate" mustache template to execute that processes the "value" to be rendered as the bar graph label. By default this template is "{{value ? Math.min(value, 100) : ''}}"
"height" in pixels of the bar visualization.
Source Properties:
The "metric" properties should be set to the appropriate metric to be retrieved by that data-source.
Example showing network out usage with the value keeping only two decimals formatted in valueTemplate:
{
    "title": "Network Out (KB)",
	"_type": "celltile/azure-bar",
	"config": {
		"display": {
			"valueTemplate": "{{value ? (value/1024).toFixed(2) : '0'}}"
		},
		"source": {
			"metric": "Network Out"
		}
	}
}Default timeframe:
By default, all cell tiles in the Matrix tile adapt to the page timeframe.
The page timeframe is the timeframe setting a dashboard or perspective is currently using. These timeframes are all relative to the current time, for example 7 days ago until now. When a user changes the page timeframe, all tiles that have use page timeframe set will adapt to the new timeframe. (Tiles that do not have use page timeframe set (i.e. are set to specific timeframe or custom timeframe) are not affected and won't change.)
Setting a specific timeframe:
You can set a fixed timeframe for cells by adding timeframe as a source property:
"source": {
			"timeframe": {
				"type": "fixed",
				"range": "last24hours"
			},
Properties
range |
Durations of 2, 4, 6 hours, or 14 days can NOT be used in the above format. The custom option can be used to set timeframes using ISO 8601 format SquaredUp DS does not support the week notation. Note: You need to make sure that the data source supports the timeframe you set (for example the Cost cell tile does not work with 1 hour or 12 hour since the timeframe is too short for the API to get data). |
type | fixed = use fixed range valueinherit = use page timeframe (default) |
Displays a sparkline graph visualization of Azure Monitor metrics data over time for a given resource.
Configuration Example:
{
    "title": "CPU",
	"_type": "celltile/azure-sparkline",
	"config": {
		"source": {
			"metric": "Percentage CPU"
		}
	}
}Type:celltile/ azure-sparkline
Display Properties:
"height" in pixels of the graph.
"width" in pixels of the graph.
"verticalMargin" the margin above and below the graph.
"labelTemplate" a mustache template to render as the label, context is latest performance value as a number value.
"fill" if set to true it will fill the area under the sparkline to display in a line-graph style.
Source Properties:
The "metric" properties should be set to the appropriate metric to be retrieved by that data-source.
Example metrics:
`"metric": "Disk Read Operations/sec" - display the disk read operation speed.
`"metric": "Percentage CPU" - Shows the CPU usage of the resource.
Default timeframe:
By default, all cell tiles in the Matrix tile adapt to the page timeframe.
The page timeframe is the timeframe setting a dashboard or perspective is currently using. These timeframes are all relative to the current time, for example 7 days ago until now. When a user changes the page timeframe, all tiles that have use page timeframe set will adapt to the new timeframe. (Tiles that do not have use page timeframe set (i.e. are set to specific timeframe or custom timeframe) are not affected and won't change.)
Setting a specific timeframe:
You can set a fixed timeframe for cells by adding timeframe as a source property:
"source": {
			"timeframe": {
				"type": "fixed",
				"range": "last24hours"
			},
Properties
range |
Durations of 2, 4, 6 hours, or 14 days can NOT be used in the above format. The custom option can be used to set timeframes using ISO 8601 format SquaredUp DS does not support the week notation. Note: You need to make sure that the data source supports the timeframe you set (for example the Cost cell tile does not work with 1 hour or 12 hour since the timeframe is too short for the API to get data). |
type | fixed = use fixed range valueinherit = use page timeframe (default) |
Using a specific timeframe in cell tiles
A specific timeframe can only be set in the cell types Bar, Cost, and Performance as Sparkline.
Default timeframe:
By default, all cell tiles in the Matrix tile adapt to the page timeframe.
The page timeframe is the timeframe setting a dashboard or perspective is currently using. These timeframes are all relative to the current time, for example 7 days ago until now. When a user changes the page timeframe, all tiles that have use page timeframe set will adapt to the new timeframe. (Tiles that do not have use page timeframe set (i.e. are set to specific timeframe or custom timeframe) are not affected and won't change.)
Setting a specific timeframe:
You can set a fixed timeframe for cells by adding timeframe as a source property:
"source": {
			"timeframe": {
				"type": "fixed",
				"range": "last24hours"
			},
Properties
range |
Durations of 2, 4, 6 hours, or 14 days can NOT be used in the above format. The custom option can be used to set timeframes using ISO 8601 format SquaredUp DS does not support the week notation. Note: You need to make sure that the data source supports the timeframe you set (for example the Cost cell tile does not work with 1 hour or 12 hour since the timeframe is too short for the API to get data). |
type | fixed = use fixed range valueinherit = use page timeframe (default) |
FAQs
Why can't I sort the Matrix tile columns?
The Matrix tile isn't really a table in the traditional sense. It is a grid or "matrix" of cell tiles - each cell tile is a separately rendered entity and the data is retrieved for each column of tiles independently from other columns. This means that the data for each column can and will load at different times.
When sorting a traditional table, either a single query or a single joined dataset is being used to sort, process and display the entire table structure. This is not the case with the Matrix tile due to the independently queried columns and asynchronously rendered matrix of cell tiles.