The Elasticssearch tile can show data from your Elasticsearch instance. Since Elasticsearch tiles are designed specifically to integrate with Elasticsearch, they offer you a convenient way to access your Elasticsearch indices and enter search queries.
If you don't already have an Elasticsearch provider, you need to create one before you can configure an Elasticsearch tile (How to add an Elasticsearch provider).
Add a new tile to a dashboard and click on Integrations > Elasticsearch.
Select the visualization for your Elasticsearch tile and click next.
A Scalar displays one value. A Scalar is useful to show a specific number like "total cost of my services" or "free disk space on this server". When a Data Stream returns multiple values (meaning a table with multiple rows), you will still be able to pick the Scalar visualization, but the Scalar will only show the value of the first row.
Example:
A table of data, for example incidents or tickets.
Tip: You can turn the individual rows into links in the settings. For example, if you're displaying tickets in your grid, you can link the rows to the ticket in your external ticket system.
Did you know? Since SquaredUp DS 5.4 users can search the grid, and temporarily change the column size and sorting of the grid (by clicking on the column headers) without having to access the settings. They can also expand a row by clicking on the three dots at the end of each row if cells are too small to show their entire content.
Shows time-series data over time, in a graph with an x-axis (time) and a y-axis. You can show several objects, such as servers, in one graph.
Example:
Visualizes time-series data as vertical columns.
Example:
Shows data over time (like line graphs), but each item gets its own graph instead of showing all lines in one graph.
Example:
Visualizes both a number and the resulting bar width based on the number value.
Example:
Shows the results in a donut shape.
Example:
Shows the state of items as icons with different colors. You can display just the icons or together with a description. You can also use a background image and drag the icons into position on the image.
Example:
Shows the state of items as blocks with different colors.
Example:
Scope Select the scope for your tile (optional).
Tip: If you experience any problems with scoping tiles, you'll find FAQs and help in the article How to scope tiles.
Note: By default, results are shown across all subscriptions (unless the subscription option is chosen to specify only one or more subscriptions).
Filter by tenant
By default results are shown across all tenants. In SquaredUp DS 4.7 and above a user who has access to multiple tenants will see a filter by tenant option.
In a multi-tenant environment a user who does not have access to all tenants will see this message if they attempt to edit a scope containing tenants that they do not have access to. This may be because:
One SquaredUp DS admin has added a tile scoped to tenants that other SquaredUp DS admins do not have permissions to.
The customer/tenant is no longer serviced by this Customer Service Provider (CSP), so the tenant has been permanently removed for all SquaredUp DS admins.
Symptoms
A tile scope shows:
"You do not have access to all of the tenants currently selected. Click here to reset which will remove those tenants from the scope."
Tenants the user does not have access to show as:
"Tenant ID could not be resolved"
Procedure
The message warns users that they do not have permissions to all the tenants in the scope.
If the user chooses to reset and therefore edit the scope then the tenants that they do not have access to will be removed. If saved this scope will also have those tenants removed for users who do have access to them.
It is not possible for the user to edit the scope without those tenants being removed from the scope.
Where a tenant has been removed permanently you may wish to reset the scope to remove the unresolvable tenants.
List
List allows you to select several individual items to show.
You can add multiple items. To remove an item click the x to the right of its name.
Tip: Start typing and after two characters you'll see suggestions that match the name appear.
Note: It depends on the tile what happens when you select more than one item. For example, when you select two virtual machines for a Status tile, you'll see the status of those VMs individually. When you select two virtual machines for a Cost Management tile, you'll see the cost for the two VMs added together.
Resource group
Select one or more resource groups.
Filter by type:
Tick filter by type to only show resources of a particular type within the chosen resource group.
Subscription
Select one or more subscriptions from the dropdown box if you wish to restrict results to only one or more subscriptions. When this is not used results are shown across all subscriptions.
Filter by type:
Tick filter by type to only show resources of a particular type within the chosen subscription.
Tags
Select items with a particular tag. Add the tag name and the tag value you want to use to search for. If you select multiple tags, the search automatically 'ANDs' the tags which means the scope only contains items which are tagged with all the tags listed.
Filter by type:
Tick filter by type to only show resources of a particular type within the chosen tag(s).
Type
Scope type can be used to show all resources of a particular type, for example all databases across all subscriptions, by typing databases and selecting SQL databases.
Show hidden types
This works in the same way as the Show hidden types option in the Azure portal.
Hidden types include some ancillary resources which are created/managed by Azure infrastructure. It might be useful to display these resources when cleaning up your resource groups or subscriptions.
Note: If you never used a perspective, you should read Working with perspectives before scoping tiles on perspectives.
The power of perspectives is that tiles on a perspective can use a dynamic scope. A dynamic scope considers the currently viewed resource. A dynamic scope consists of two different states:
the configuration of the scope in the tile (for example, "consider child objects of type logical disk for the currently viewed object")
the actual resolved scope that depends on which resource you are currently viewing ("this object has 5 child objects of type logical disk")
After configuring the dynamic scope once in the tile, you'll get different results depending how the scope is resolved on the different resources you are viewing.
On perspectives, you can scope tiles to:
this resource (only on perspectives for resources)
The tile's scope will be the resolved to the resource that is currently viewed.
child resources (only on perspectives for resource groups and subscriptions)
When you select this option, the scope of the tile will be resolved to all resources that are in the group or subscription that is currently viewed.
If you want to narrow the scope down to a specific type of resource in the group or subscription, you can filter for one specific type of resource.
other resources
Gives you the normal, non-dynamic scope options you are used to when scoping tiles on dashboards. This means the tile will not dynamically adapt it's content to the currently viewed resource, it will always show data for the static resource picked here.
Since the power of perspectives is that their tiles can show data for different resources depending on what resource is currently being viewed, you should only select this option when you are sure that there is no relationship between the desired scope and the currently viewed resource.
When you select a resource group in the resource group section, the status for resources within that resource group will be shown.
Provider: Select your Elasticsearch provider from the select provider drop-down and click next.
You can only use providers of the same type as the tile. Providers of other types won't be shown in the select provider drop-down.
Query: Index: Click in the field to see a list of all indices that exist in the Elasticsearch provider you chose. Choose the index or indices you want to use for your tile. Search type(not for line graphs and sparklines): Here you enter the search query for the data you want to display. You can choose between the options lucene, where you need to use Lucene query syntax, and query dsl, where you need to use Query DSL syntax. If a simple lucene query is not sufficient for your data request, switch to query dsl to specify your request. Search(only for line graphs and sparklines): Here you enter the search query for the data you want to display. You need to use Query DSL syntax. There's already a default query with a simple aggregation in the search field to help you get started.
If you want to use aggregation:
For using aggregations like an average or a "min/max of the last 20 days for performance scores", your search query must include the date_histogram as either the top-level aggregation or as a sub-aggregation. Multiple aggregations are supported. You should set size to 0 to make your responses smaller and faster.
If you used any kind of aggregation in your search query, you don't need to use the data mapping panel. The tile will automatically do the data mapping based on your search query.
You can use raw data (for example, a performance counter for CPU once every 5 minutes), but you'll need to map the raw data in the data mapping panel to display them.
The results of your search must include a numeric value.
Your search query must define the size,which controls how many data points you'll get back. You need to make sure that the size is big enough the timeframe and all entities you want to see in the graph.
Example: You want to see results for the CPU performance of 3 servers for the last 10 days, and the performance counter collects results once every 5 minutes: 14400 minutes (10 days), divided by 5 minutes (performance counter data collection points) = 2880. Since you want to get results for 3 servers, you need 8640 data points as a size.
Note: For your queries, you need to know the names of the columns in the index you are using. You can find the column names in your elasticsearch index. The templates button to access search query templates you have created in Elasticsearch. Using a template will copy the search query template into the field, which means that if you make changes to the template in Elasticsearch, those changes will not be automatically pulled into the tile.
If you defined a scope you can use the mustache picker to insert scope variables (values that refer only to the defined scope) into your query.
Values that refer to the defined scope carry the prefix scope. before the value. For example, you can use the value {{scope[0].displayName}} for the name of the first item in your scope. You can manipulate the values with javascript syntax. For example, if you want to insert a quoted comma separated list of displayNames from every item in the scope, you can use {{scope.map(item => '"'+item.displayName+'"').join(',')}}.
You can use the clock insert time value button to insert page timeframe and date variables in your query.
The page timeframe is the timeframe setting a dashboard or perspective is currently using. These timeframes are all relative to the current time, for example 7 days ago until now. When a user changes the page timeframe, all tiles that have use page timeframe set will adapt to the new timeframe. (Tiles that do not have use page timeframe set (i.e. are set to specific timeframe or custom timeframe) are not affected and won't change.)
If you don't use page timeframe variables, the tile will ignore the page timeframe setting by a user.
Available dynamic page timeframe variables
timeframe.isoDuration
Use this format when you want to insert the page timeframe according to the ISO 8601 format
Example: When the page timeframe is set to "last 12 hours" the string PT12H is inserted.
timeframe.isoStart
Use this format to insert a "from" time when you want the starting point to be "now minus page timeframe". The page timeframe will be inserted as a starting time according to the ISO 8601 format
Example: When the page timeframe is set to "last 12 hours" the starting time is "now minus 12 hours".
timeframe.isoEnd
Use this format to insert a "to" time when you need to specify the end time. The end time is always "now". The current time will be inserted according to the ISO 8601 format
timeframe.unixStart
Use this format to insert a "from" time when you want the starting point to be "now minus page timeframe". The page timeframe will be inserted as a starting time in milliseconds according to the UNIX standard.
Example: When the page timeframe is set to "last 12 hours", the starting time is "now minus 12 hours".
timeframe.unixEnd
Use this format to insert a "to" time when you need to specify the end time. The end time is always "now". The current time will be inserted in milliseconds according to the Unix standard.
Math.floor(timeframe.UnixStart / 1000)
Use this format when you want to use the unixStart time but need to convert it from milliseconds to seconds.
Math.floor(timeframe.UnixEnd / 1000)
Use this format when you want to use the unixEnd time but need to convert it from milliseconds to seconds.
Available fixed date variables
Date.now() - 86400 * 1000 *14
This is a template format to express the fixed timeframe "14 days ago" (now minus 14 days in milliseconds). You can use this template to create your own fixed timeframe.
How to read the parameters of the template:
Date.now() = the current date and time (now) in milliseconds 86400 = 24 hours in seconds 1000 = converts the seconds into milliseconds 14 = 14 days
If you want to use a fixed timeframe in seconds, you need to convert the Date.now() into seconds, for example "4 days ago in seconds": (Date.now() /1000) - 86400 * 4.
new Date().toISOString()
A text based representation of "now". Use this format if you want to insert the date as a string in ISO 8601 format
Click next.
Response data (only for bar graphs, donuts, scalars, grids, and status icons or blocks)
Here you can see the response data from the query in the response data field. For most use cases, you need to limit the query response to the specific property you want to use for your data. You pick the property you want to use by entering the key path to the property in the key path field. If you don't need to limit the query result and can use the entire response (for example, if the response data returns the array you want to use at the root of the response), you can leave the key path field empty.
The structure of the response data tells you where to find the property you want to use. Example:
If your response data looks like the example above and you want to display the "value" of "hits", you need to enter hits.total.value in the key path field. If you want to use the whole array of "hits", you need to enter hits in the key path field.
Click next.
Settings for the visualization: Configure the settings for the visualization you chose.
Scalar
Font size
Allows you to set the font size of the value in the tile.
Alignment
Select the scalar text alignment. Choose from left, center or right.
Unit
Allows you to add a unit to the value displayed in the Scalar tile. For example, if your value shows a time in milliseconds, you can enter "ms" or if your value shows pageviews, you can enter "pageviews".
Value formatter
Allows you to format the value by using the mustache picker. For example, you can round the value up or down or convert it.
Color
Conditional formatting:
You can display the data in different colors based on values you define here. For example, you can display the data in green when the value is below 100 and in red when it is above 100.
Click on add to configure a condition.
Click on select color.... to open the color picker. Select the color for this condition.
Enter your condition in the field next to the color. You can use the value property and manipulate it with JavaScript String and Regex APIs. When you click on the mustache picker, you'll get some examples:
Value is greater than something, less than something, etc. For example: {{value < 10}} (The color you pick will be used if the value is less than 10)
Value is present in the result (scalar tiles only) For example: value.IndexOf('error') != -1 (The color you pick will be used if the string value "error" is present in the results)
Value matches one of the regular expressions you defined (scalar tiles only) For example: value.match(/healthy|good|up/) (The color you picked will be used if the string values are healthy, good, or up)
Display:
Here you decide how the color is used:
Tile background
Highlight the tile in the color you defined.
Text foreground
Display the text in the color you defined.
Link options
Allows you to turn the graph item(s) into links. You can either enter plain text to create a fixed link (URL always stays the same) or use dynamic properties to create a dynamic link.
Dynamic links make use of dynamic properties which are inserted as part of the URL. This creates a template URL that will be resolved to an actual URL based on the items properties.
For example, if you want to link to tickets in your ticket system and the format of the URL for tickets in your system is https://www.my-system/ticket-123, where 123 is the ticket ID, you can use the dynamic property that contains the ticket ID and enter the dynamic URL https://www.my-system/ticket-{{ticketID}}.
For scalars, you can only use the dynamic property value in dynamic links, which means the link changes when the value of the scalar changes. Since a scalar is just one item, it would also make sense to use a fixed link, for example the link to the website of which you are displaying the response time.
For status icon or bars and the rows of a grid, you usually want to use a dynamic link since you get multiple items or rows that represent different things. You can use any of the dynamic properties the mustache picker offers you.
Dynamic mustache properties and values you need to change according to your instance are highlighted in bold.
Property names that contain hyphens (for example properties.name-with-hyphens) can't be processed due to a JavaScript limitation. If you want to use a property that contains a hyphen, you have two options:
If you have access to the data source and can change the name of the property, change the name of the property to a name without hyphens. For example, if your Elasticsearch query uses a property (an aggregation, a grouping or any other property you want to use) with a name that contains a hyphen, you can either access your Elasticsearch instance and change the name there or you can overwrite the name in the query dsl field.
If you can't change the name of the property, you need to enter the property name in the following format: Original property name: {{properties.name-with-hyphens.value}} New format: {{properties['name-with-hyphens'].value}}
Grid options
Row link
Allows you to turn the graph item(s) into links. You can either enter plain text to create a fixed link (URL always stays the same) or use dynamic properties to create a dynamic link.
Dynamic links make use of dynamic properties which are inserted as part of the URL. This creates a template URL that will be resolved to an actual URL based on the items properties.
For example, if you want to link to tickets in your ticket system and the format of the URL for tickets in your system is https://www.my-system/ticket-123, where 123 is the ticket ID, you can use the dynamic property that contains the ticket ID and enter the dynamic URL https://www.my-system/ticket-{{ticketID}}.
For scalars, you can only use the dynamic property value in dynamic links, which means the link changes when the value of the scalar changes. Since a scalar is just one item, it would also make sense to use a fixed link, for example the link to the website of which you are displaying the response time.
For status icon or bars and the rows of a grid, you usually want to use a dynamic link since you get multiple items or rows that represent different things. You can use any of the dynamic properties the mustache picker offers you.
Dynamic mustache properties and values you need to change according to your instance are highlighted in bold.
Property names that contain hyphens (for example properties.name-with-hyphens) can't be processed due to a JavaScript limitation. If you want to use a property that contains a hyphen, you have two options:
If you have access to the data source and can change the name of the property, change the name of the property to a name without hyphens. For example, if your Elasticsearch query uses a property (an aggregation, a grouping or any other property you want to use) with a name that contains a hyphen, you can either access your Elasticsearch instance and change the name there or you can overwrite the name in the query dsl field.
If you can't change the name of the property, you need to enter the property name in the following format: Original property name: {{properties.name-with-hyphens.value}} New format: {{properties['name-with-hyphens'].value}}
Show column headers
You can choose between showing or hiding the header for all columns.
Expand rows automatically
Activate this checkbox if you want the row height to expand automatically based on the row content, for example if your grid uses increased text size, images, emojis etc.
Limit number of results displayed
You can set a limit of the initial number of results displayed in the grid. If you have set a limit and there are more results to display, users will see a "show all" button below the grid.
Font size
Use the slider to adjust the font size.
Tip for column sizing: You can change the column width directly in the grid by clicking on the divider lines between columns and dragging them to the width you want. You need to show column headers (by activating the show column headers check box) to be able to change the column width. Resizing columns while in edit mode affects how the grid looks by default when users open the dashboard. Users can temporarily change the column sizes by dragging them, but those changes only last until they leave the page.
Data mapping
If you used any kind of aggregation in your search query, you don't need to use the data mapping panel. The tile will automatically do the data mapping based on your search query.
If you are not using aggregated data, you need to check the display raw data checkbox and map your raw data here:
Property names that contain hyphens (for example properties.name-with-hyphens) can't be processed due to a JavaScript limitation. If you want to use a property that contains a hyphen, you have two options:
If you have access to the data source and can change the name of the property, change the name of the property to a name without hyphens. For example, if your Elasticsearch query uses a property (an aggregation, a grouping or any other property you want to use) with a name that contains a hyphen, you can either access your Elasticsearch instance and change the name there or you can overwrite the name in the query dsl field.
If you can't change the name of the property, you need to enter the property name in the following format: Original property name: {{properties.name-with-hyphens.value}} New format: {{properties['name-with-hyphens'].value}}
group by
Here you can define a group to take a closer look at the graph's value(s). Each item in the group will create its own series (a line in a line graph, a bar in a bar graph etc.). For example, if you group the value response time by servers on a line graph, you'll see one line per server, each line showing you the response time for this one server over time.
To enter your grouping, you have to find the property that contains it. You can use the mustache picker to see every property returned from the response data. Pick the property that contains the grouping you want your graph to show.
Note: If you type in the property, make sure you add the mustache {{}} to the property name. Otherwise, you'll either get an error message or the property will be interpreted as a static value and be the same for every result.
Note: If your grouping needs more than one property, you can combine multiple properties. For example, if you want to see the disk space on the c: drive of different computers, your grouping needs to be c: drive and computer. You can combine them in one mustache {{PropertyForComputer + PropertyForC:Drive}} or keep them in separate mustaches {{PropertyForComputer} {PropertyForC:Drive}}.
timestamp
Here you define the time series to be used for the visualization.
To enter your timestamp, you have to find the property that contains it. If there is a mustache picker you can use this to see every property from the response data. Pick the property that contains the timestamp you want the visualization to use.
Note: If you type in the property, make sure you add the mustache {{}} to the property name. Otherwise, you'll either get an error message or the property will be interpreted as a static value and be the same for every result.
Note: Timestamps that are supported are Unix timestamp in milliseconds or the ISO 8601 format
metrics
Here you define which value the graph will show. For example, if you want to see the response time of different servers, your metric value would be response time. If you want to see the number of tickets, your metric value would be number (of tickets).
To enter your metric value, you have to find the property that contains that value. You can use the mustache picker to see every property returned from the response data. Pick the property that contains the value you want your graph to show
Note: If you type in the property, make sure you add the mustache {{}} to the property name. Otherwise, you'll either get an error message or the property will be interpreted as a static value and be the same for every result.
Note: The metric value must be a numeric object. If an API returns values as strings, you can convert them from a string to a numeric object with the parseFloat() function.
Info: You can manipulate the value by adding operators to add, substract, divide or multiply. You can pick additonal properties from the response data or insert plain text for those functions. For example, if you want to multiply two properties you can do that by entering {{PropertyForMetricValue*PropertyForOtherMetricValue2}} . If you want to change Kb in Gb you can divide the value by 1024: {{PropertyForMetricValue/1024}}. You can also use more elaborate functions according to JavaScript syntax.
Extract multiple metrics:
If you want to see more than one value, you can tick the "Extract multiple metrics" checkbox. You can manipulate those metrics exactly like the first metric you chose. The metrics won't affect each other, they are all treated as separate metrics. Each value will get its own series (a line in a line graph, a bar in a bar graph etc.).
Top N
Here you can define a limit for the number of results you want to see. Activate the limit number of results displayed checkbox to enter a limit for results. You can choose if this limit should be applied from the top ranking results down (ascending, default option) or from the bottom ranking results up (descending).
Threshold
You can choose to apply a threshold line at a specified value, and whether you wish to fill above or below this value, or just show the line. For example, for free disk space you might want to fill below the line to highlight when space goes below a particular threshold. For processor information you might want to fill above the line to highlight when processor percentage goes above that threshold. The threshold is also shown on the drilldown view.
Max, min, avg
When drilled-down to view a graph, you can select the min, max and avgoptions for each object (displayed to the right of the graph), which displays a line cutting horizontally across the graph a each of the selected value points.
Data range
The Data Range option allows you to choose the range of data the graph will display. For line graphs, this means the data on the y-axis.
percentage
Shows 0 to 100
fit to data
Shows the data minimum to data maximum
fit to data (from zero)
Shows from 0 to the data maximum
custom
Allows you to specify the min and max
custom fit
Allows you to specify the min and max limits, so that data outside your settings will not be shown. If all the data falls within your specified ranges then the y-axis range will fit to the data rather than your caps.
Display
Height:
Allows you to set the height of the tile with a slider.
Show hover details:
Shows the value for all lines at any point you hover. There may not be a value exactly where you hover so the value is interpolated from the values either side.
Show points:
Shows where the data points are on the line. Useful to identify missing points, or detail for changing data.
Show trend
Enable the Show Trend Linestoggle to display a trend line for the line graph data. Disable the toggle to hide the trend line.
Custom colors:
You can display the data in different colors based on labels. For example, you can display data in green for a specific user.
Click on select color.... to open the color picker. Select the color for this condition.
Enter your condition in the field next to the color. You can use the label property and manipulate it with JavaScript String and Regex APIs. When you click on the mustache picker, you'll get some examples:
Condition is true if the label contains something For example: {{label.indexOf('SQL') != -1}} (The color you pick will be used if the label contains 'SQL')
Condition is true if the label contains multiple things For example: {{label.match(/C:|D:|E:/) != null}} (The color you pick will be used if the label contains 'C:', 'D:' or 'E:')
Condition is true if the label contains multiple things with multiple variations For example: {{label.match(/^[Ss]erver[0-9]+$/) != null}} (The color you pick will be used if the label is 'Server' or 'server' with a number after it)
Label
Allows you to change the label of the results.
Show legend:
Allows you to show or hide the legend of the graph.
Label:
auto
Choose this option if you want to use the default label that has been created automatically.
custom
Here you can change the label to a custom label. You can use static text and dynamic properties. Use the mustache picker to select dynamic properties from the response data to use them as labels.
Property names that contain hyphens (for example properties.name-with-hyphens) can't be processed due to a JavaScript limitation. If you want to use a property that contains a hyphen, you have two options:
If you have access to the data source and can change the name of the property, change the name of the property to a name without hyphens. For example, if your Elasticsearch query uses a property (an aggregation, a grouping or any other property you want to use) with a name that contains a hyphen, you can either access your Elasticsearch instance and change the name there or you can overwrite the name in the query dsl field.
If you can't change the name of the property, you need to enter the property name in the following format: Original property name: {{properties.name-with-hyphens.value}} New format: {{properties['name-with-hyphens'].value}}
Data mapping
If you used any kind of aggregation in your search query, you don't need to use the data mapping panel. The tile will automatically do the data mapping based on your search query.
If you are not using aggregated data, you need to check the display raw data checkbox and map your raw data here:
Property names that contain hyphens (for example properties.name-with-hyphens) can't be processed due to a JavaScript limitation. If you want to use a property that contains a hyphen, you have two options:
If you have access to the data source and can change the name of the property, change the name of the property to a name without hyphens. For example, if your Elasticsearch query uses a property (an aggregation, a grouping or any other property you want to use) with a name that contains a hyphen, you can either access your Elasticsearch instance and change the name there or you can overwrite the name in the query dsl field.
If you can't change the name of the property, you need to enter the property name in the following format: Original property name: {{properties.name-with-hyphens.value}} New format: {{properties['name-with-hyphens'].value}}
group by
Here you can define a group to take a closer look at the graph's value(s). Each item in the group will create its own series (a line in a line graph, a bar in a bar graph etc.). For example, if you group the value response time by servers on a line graph, you'll see one line per server, each line showing you the response time for this one server over time.
To enter your grouping, you have to find the property that contains it. You can use the mustache picker to see every property returned from the response data. Pick the property that contains the grouping you want your graph to show.
Note: If you type in the property, make sure you add the mustache {{}} to the property name. Otherwise, you'll either get an error message or the property will be interpreted as a static value and be the same for every result.
Note: If your grouping needs more than one property, you can combine multiple properties. For example, if you want to see the disk space on the c: drive of different computers, your grouping needs to be c: drive and computer. You can combine them in one mustache {{PropertyForComputer + PropertyForC:Drive}} or keep them in separate mustaches {{PropertyForComputer} {PropertyForC:Drive}}.
timestamp
Here you define the time series to be used for the visualization.
To enter your timestamp, you have to find the property that contains it. If there is a mustache picker you can use this to see every property from the response data. Pick the property that contains the timestamp you want the visualization to use.
Note: If you type in the property, make sure you add the mustache {{}} to the property name. Otherwise, you'll either get an error message or the property will be interpreted as a static value and be the same for every result.
Note: Timestamps that are supported are Unix timestamp in milliseconds or the ISO 8601 format
metrics
Here you define which value the graph will show. For example, if you want to see the response time of different servers, your metric value would be response time. If you want to see the number of tickets, your metric value would be number (of tickets).
To enter your metric value, you have to find the property that contains that value. You can use the mustache picker to see every property returned from the response data. Pick the property that contains the value you want your graph to show
Note: If you type in the property, make sure you add the mustache {{}} to the property name. Otherwise, you'll either get an error message or the property will be interpreted as a static value and be the same for every result.
Note: The metric value must be a numeric object. If an API returns values as strings, you can convert them from a string to a numeric object with the parseFloat() function.
Info: You can manipulate the value by adding operators to add, substract, divide or multiply. You can pick additonal properties from the response data or insert plain text for those functions. For example, if you want to multiply two properties you can do that by entering {{PropertyForMetricValue*PropertyForOtherMetricValue2}} . If you want to change Kb in Gb you can divide the value by 1024: {{PropertyForMetricValue/1024}}. You can also use more elaborate functions according to JavaScript syntax.
Extract multiple metrics:
If you want to see more than one value, you can tick the "Extract multiple metrics" checkbox. You can manipulate those metrics exactly like the first metric you chose. The metrics won't affect each other, they are all treated as separate metrics. Each value will get its own series (a line in a line graph, a bar in a bar graph etc.).
Threshold
You can choose to apply a threshold line at a specified value, and whether you wish to fill above or below this value, or just show the line. For example, for free disk space you might want to fill below the line to highlight when space goes below a particular threshold. For processor information you might want to fill above the line to highlight when processor percentage goes above that threshold. The threshold is also shown on the drilldown view.
Data range
The Data Range option allows you to choose the range of data the graph will display. For line graphs, this means the data on the y-axis.
percentage
Shows 0 to 100
fit to data
Shows the data minimum to data maximum
fit to data (from zero)
Shows from 0 to the data maximum
custom
Allows you to specify the min and max
custom fit
Allows you to specify the min and max limits, so that data outside your settings will not be shown. If all the data falls within your specified ranges then the y-axis range will fit to the data rather than your caps.
Display
Height:
Allows you to set the height of the tile with a slider.
Show hover details:
Shows the value for all lines at any point you hover. There may not be a value exactly where you hover so the value is interpolated from the values either side.
Solid bars:
Show the bars as solid color or translucent.
Custom colors:
You can display the data in different colors based on labels. For example, you can display data in green for a specific user.
Click on select color.... to open the color picker. Select the color for this condition.
Enter your condition in the field next to the color. You can use the label property and manipulate it with JavaScript String and Regex APIs. When you click on the mustache picker, you'll get some examples:
Condition is true if the label contains something For example: {{label.indexOf('SQL') != -1}} (The color you pick will be used if the label contains 'SQL')
Condition is true if the label contains multiple things For example: {{label.match(/C:|D:|E:/) != null}} (The color you pick will be used if the label contains 'C:', 'D:' or 'E:')
Condition is true if the label contains multiple things with multiple variations For example: {{label.match(/^[Ss]erver[0-9]+$/) != null}} (The color you pick will be used if the label is 'Server' or 'server' with a number after it)
Label
Allows you to change the label of the results.
Show legend:
Allows you to show or hide the legend of the graph.
Label:
auto
Choose this option if you want to use the default label that has been created automatically.
custom
Here you can change the label to a custom label. You can use static text and dynamic properties. Use the mustache picker to select dynamic properties from the response data to use them as labels.
Property names that contain hyphens (for example properties.name-with-hyphens) can't be processed due to a JavaScript limitation. If you want to use a property that contains a hyphen, you have two options:
If you have access to the data source and can change the name of the property, change the name of the property to a name without hyphens. For example, if your Elasticsearch query uses a property (an aggregation, a grouping or any other property you want to use) with a name that contains a hyphen, you can either access your Elasticsearch instance and change the name there or you can overwrite the name in the query dsl field.
If you can't change the name of the property, you need to enter the property name in the following format: Original property name: {{properties.name-with-hyphens.value}} New format: {{properties['name-with-hyphens'].value}}
Data mapping
If you used any kind of aggregation in your search query, you don't need to use the data mapping panel. The tile will automatically do the data mapping based on your search query.
If you are not using aggregated data, you need to check the display raw data checkbox and map your raw data here:
Property names that contain hyphens (for example properties.name-with-hyphens) can't be processed due to a JavaScript limitation. If you want to use a property that contains a hyphen, you have two options:
If you have access to the data source and can change the name of the property, change the name of the property to a name without hyphens. For example, if your Elasticsearch query uses a property (an aggregation, a grouping or any other property you want to use) with a name that contains a hyphen, you can either access your Elasticsearch instance and change the name there or you can overwrite the name in the query dsl field.
If you can't change the name of the property, you need to enter the property name in the following format: Original property name: {{properties.name-with-hyphens.value}} New format: {{properties['name-with-hyphens'].value}}
group by
Here you can define a group to take a closer look at the graph's value(s). Each item in the group will create its own series (a line in a line graph, a bar in a bar graph etc.). For example, if you group the value response time by servers on a line graph, you'll see one line per server, each line showing you the response time for this one server over time.
To enter your grouping, you have to find the property that contains it. You can use the mustache picker to see every property returned from the response data. Pick the property that contains the grouping you want your graph to show.
Note: If you type in the property, make sure you add the mustache {{}} to the property name. Otherwise, you'll either get an error message or the property will be interpreted as a static value and be the same for every result.
Note: If your grouping needs more than one property, you can combine multiple properties. For example, if you want to see the disk space on the c: drive of different computers, your grouping needs to be c: drive and computer. You can combine them in one mustache {{PropertyForComputer + PropertyForC:Drive}} or keep them in separate mustaches {{PropertyForComputer} {PropertyForC:Drive}}.
timestamp
Here you define the time series to be used for the visualization.
To enter your timestamp, you have to find the property that contains it. If there is a mustache picker you can use this to see every property from the response data. Pick the property that contains the timestamp you want the visualization to use.
Note: If you type in the property, make sure you add the mustache {{}} to the property name. Otherwise, you'll either get an error message or the property will be interpreted as a static value and be the same for every result.
Note: Timestamps that are supported are Unix timestamp in milliseconds or the ISO 8601 format
metrics
Here you define which value the graph will show. For example, if you want to see the response time of different servers, your metric value would be response time. If you want to see the number of tickets, your metric value would be number (of tickets).
To enter your metric value, you have to find the property that contains that value. You can use the mustache picker to see every property returned from the response data. Pick the property that contains the value you want your graph to show
Note: If you type in the property, make sure you add the mustache {{}} to the property name. Otherwise, you'll either get an error message or the property will be interpreted as a static value and be the same for every result.
Note: The metric value must be a numeric object. If an API returns values as strings, you can convert them from a string to a numeric object with the parseFloat() function.
Info: You can manipulate the value by adding operators to add, substract, divide or multiply. You can pick additonal properties from the response data or insert plain text for those functions. For example, if you want to multiply two properties you can do that by entering {{PropertyForMetricValue*PropertyForOtherMetricValue2}} . If you want to change Kb in Gb you can divide the value by 1024: {{PropertyForMetricValue/1024}}. You can also use more elaborate functions according to JavaScript syntax.
Extract multiple metrics:
If you want to see more than one value, you can tick the "Extract multiple metrics" checkbox. You can manipulate those metrics exactly like the first metric you chose. The metrics won't affect each other, they are all treated as separate metrics. Each value will get its own series (a line in a line graph, a bar in a bar graph etc.).
Data Range
The Data Range option allows you to choose the range of data the graph will display. For line graphs, this means the data on the y-axis.
percentage
Shows 0 to 100
fit to data
Shows the data minimum to data maximum
fit to data (from zero)
Shows from 0 to the data maximum
custom
Allows you to specify the min and max
custom fit
Allows you to specify the min and max limits, so that data outside your settings will not be shown. If all the data falls within your specified ranges then the y-axis range will fit to the data rather than your caps.
Sort
Sort allows you to change the order of the results displayed. You can sort by value (ascending or descending) or label (alphabetically ascending or descending).
Label
Allows you to change the label of the results.
auto
Choose this option if you want to use the default label that has been created automatically.
custom
Here you can change the label to a custom label. You can use static text and dynamic properties. Use the mustache picker to select dynamic properties from the response data to use them as labels.
Property names that contain hyphens (for example properties.name-with-hyphens) can't be processed due to a JavaScript limitation. If you want to use a property that contains a hyphen, you have two options:
If you have access to the data source and can change the name of the property, change the name of the property to a name without hyphens. For example, if your Elasticsearch query uses a property (an aggregation, a grouping or any other property you want to use) with a name that contains a hyphen, you can either access your Elasticsearch instance and change the name there or you can overwrite the name in the query dsl field.
If you can't change the name of the property, you need to enter the property name in the following format: Original property name: {{properties.name-with-hyphens.value}} New format: {{properties['name-with-hyphens'].value}}
Color
multiple colors
Here you can enable or disable graph color matching.
If you turn color matching on, one item (a specific resource, object, site, anything you are displaying in your graphs) is shown in the same color in different graphs on one dashboard or one perspective. You can use either color matching or custom colors (colors based on values), they cannot both be used at the same time.
custom colors
Setting colors based on values
You can display the data in different colors based on values you define here. For example, you can display the data in green when the value is below 100 and in red when it is above 100.
Click on add to configure a condition.
Click on select color.... to open the color picker. Select the color for this condition.
Enter your condition in the field next to the color. You can use the value property and manipulate it with JavaScript String and Regex APIs. When you click on the mustache picker, you'll get some examples:
Value is greater than something, less than something, etc. For example: {{value < 10}} (The color you pick will be used if the value is less than 10)
Value is present in the result (scalar tiles only) For example: value.IndexOf('error') != -1 (The color you pick will be used if the string value "error" is present in the results)
Value matches one of the regular expressions you defined (scalar tiles only) For example: value.match(/healthy|good|up/) (The color you picked will be used if the string values are healthy, good, or up)
You are able to combine value matching with label matching.
Setting colors based on labels
You can display the data in different colors based on labels. For example, you can display data in green for a specific user.
Click on select color.... to open the color picker. Select the color for this condition.
Enter your condition in the field next to the color. You can use the label property and manipulate it with JavaScript String and Regex APIs. When you click on the mustache picker, you'll get some examples:
Condition is true if the label contains something For example: {{label.indexOf('SQL') != -1}} (The color you pick will be used if the label contains 'SQL')
Condition is true if the label contains multiple things For example: {{label.match(/C:|D:|E:/) != null}} (The color you pick will be used if the label contains 'C:', 'D:' or 'E:')
Condition is true if the label contains multiple things with multiple variations For example: {{label.match(/^[Ss]erver[0-9]+$/) != null}} (The color you pick will be used if the label is 'Server' or 'server' with a number after it)
You are able to combine label matching with value matching.
Data mapping
Property names that contain hyphens (for example properties.name-with-hyphens) can't be processed due to a JavaScript limitation. If you want to use a property that contains a hyphen, you have two options:
If you have access to the data source and can change the name of the property, change the name of the property to a name without hyphens. For example, if your Elasticsearch query uses a property (an aggregation, a grouping or any other property you want to use) with a name that contains a hyphen, you can either access your Elasticsearch instance and change the name there or you can overwrite the name in the query dsl field.
If you can't change the name of the property, you need to enter the property name in the following format: Original property name: {{properties.name-with-hyphens.value}} New format: {{properties['name-with-hyphens'].value}}
data aggregation
Here you can aggregate the results of the return data.
none: No aggregation, use raw data (for example, when the data provided by the API has already been aggregated in some way due to the type of request).
count: Count how many results are returned (for example, when you return a list of unavailable servers, you can count the results to show how many servers are unavailable).
sum: Show the sum of all results (for example, your return data is a list of tickets in various states and you want to know how many tickets there are in total). For sum, you need numeric values. If your return data contains strings, you need to convert them into a numeric value.
grouping
Here you can define a group to take a closer look at the graph's value(s). Each item in the group will create its own series (a line in a line graph, a bar in a bar graph etc.). For example, if you group the value response time by servers on a line graph, you'll see one line per server, each line showing you the response time for this one server over time.
To enter your grouping, you have to find the property that contains it. You can use the mustache picker to see every property returned from the response data. Pick the property that contains the grouping you want your graph to show.
Note: If you type in the property, make sure you add the mustache {{}} to the property name. Otherwise, you'll either get an error message or the property will be interpreted as a static value and be the same for every result.
Note: If your grouping needs more than one property, you can combine multiple properties. For example, if you want to see the disk space on the c: drive of different computers, your grouping needs to be c: drive and computer. You can combine them in one mustache {{PropertyForComputer + PropertyForC:Drive}} or keep them in separate mustaches {{PropertyForComputer} {PropertyForC:Drive}}.
metrics
Here you define which value the graph will show. For example, if you want to see the response time of different servers, your metric value would be response time. If you want to see the number of tickets, your metric value would be number (of tickets).
To enter your metric value, you have to find the property that contains that value. You can use the mustache picker to see every property returned from the response data. Pick the property that contains the value you want your graph to show
Note: If you type in the property, make sure you add the mustache {{}} to the property name. Otherwise, you'll either get an error message or the property will be interpreted as a static value and be the same for every result.
Note: The metric value must be a numeric object. If an API returns values as strings, you can convert them from a string to a numeric object with the parseFloat() function.
Info: You can manipulate the value by adding operators to add, substract, divide or multiply. You can pick additonal properties from the response data or insert plain text for those functions. For example, if you want to multiply two properties you can do that by entering {{PropertyForMetricValue*PropertyForOtherMetricValue2}} . If you want to change Kb in Gb you can divide the value by 1024: {{PropertyForMetricValue/1024}}. You can also use more elaborate functions according to JavaScript syntax.
Extract multiple metrics:
If you want to see more than one value, you can tick the "Extract multiple metrics" checkbox. You can manipulate those metrics exactly like the first metric you chose. The metrics won't affect each other, they are all treated as separate metrics. Each value will get its own series (a line in a line graph, a bar in a bar graph etc.).
Data Range
The Data Range option allows you to choose the range of data the graph will display. For line graphs, this means the data on the y-axis.
percentage
Shows 0 to 100
fit to data
Shows the data minimum to data maximum
fit to data (from zero)
Shows from 0 to the data maximum
custom
Allows you to specify the min and max
custom fit
Allows you to specify the min and max limits, so that data outside your settings will not be shown. If all the data falls within your specified ranges then the y-axis range will fit to the data rather than your caps.
Sort
Sort allows you to change the order of the results displayed. You can sort by value (ascending or descending) or label (alphabetically ascending or descending).
Value
Value formatter
Allows you to format the value by using the mustache picker. For example, you can round the value up or down or convert it.
Label
Allows you to change the label of the results.
auto
Choose this option if you want to use the default label that has been created automatically.
custom
Here you can change the label to a custom label. You can use static text and dynamic properties. Use the mustache picker to select dynamic properties from the response data to use them as labels.
Property names that contain hyphens (for example properties.name-with-hyphens) can't be processed due to a JavaScript limitation. If you want to use a property that contains a hyphen, you have two options:
If you have access to the data source and can change the name of the property, change the name of the property to a name without hyphens. For example, if your Elasticsearch query uses a property (an aggregation, a grouping or any other property you want to use) with a name that contains a hyphen, you can either access your Elasticsearch instance and change the name there or you can overwrite the name in the query dsl field.
If you can't change the name of the property, you need to enter the property name in the following format: Original property name: {{properties.name-with-hyphens.value}} New format: {{properties['name-with-hyphens'].value}}
Color
multiple colors
Here you can enable or disable graph color matching.
If you turn color matching on, one item (a specific resource, object, site, anything you are displaying in your graphs) is shown in the same color in different graphs on one dashboard or one perspective. You can use either color matching or custom colors (colors based on values), they cannot both be used at the same time.
custom colors
Setting colors based on values
You can display the data in different colors based on values you define here. For example, you can display the data in green when the value is below 100 and in red when it is above 100.
Click on add to configure a condition.
Click on select color.... to open the color picker. Select the color for this condition.
Enter your condition in the field next to the color. You can use the value property and manipulate it with JavaScript String and Regex APIs. When you click on the mustache picker, you'll get some examples:
Value is greater than something, less than something, etc. For example: {{value < 10}} (The color you pick will be used if the value is less than 10)
Value is present in the result (scalar tiles only) For example: value.IndexOf('error') != -1 (The color you pick will be used if the string value "error" is present in the results)
Value matches one of the regular expressions you defined (scalar tiles only) For example: value.match(/healthy|good|up/) (The color you picked will be used if the string values are healthy, good, or up)
You are able to combine value matching with label matching.
Setting colors based on labels
You can display the data in different colors based on labels. For example, you can display data in green for a specific user.
Click on select color.... to open the color picker. Select the color for this condition.
Enter your condition in the field next to the color. You can use the label property and manipulate it with JavaScript String and Regex APIs. When you click on the mustache picker, you'll get some examples:
Condition is true if the label contains something For example: {{label.indexOf('SQL') != -1}} (The color you pick will be used if the label contains 'SQL')
Condition is true if the label contains multiple things For example: {{label.match(/C:|D:|E:/) != null}} (The color you pick will be used if the label contains 'C:', 'D:' or 'E:')
Condition is true if the label contains multiple things with multiple variations For example: {{label.match(/^[Ss]erver[0-9]+$/) != null}} (The color you pick will be used if the label is 'Server' or 'server' with a number after it)
You are able to combine label matching with value matching.
Data mapping
Property names that contain hyphens (for example properties.name-with-hyphens) can't be processed due to a JavaScript limitation. If you want to use a property that contains a hyphen, you have two options:
If you have access to the data source and can change the name of the property, change the name of the property to a name without hyphens. For example, if your Elasticsearch query uses a property (an aggregation, a grouping or any other property you want to use) with a name that contains a hyphen, you can either access your Elasticsearch instance and change the name there or you can overwrite the name in the query dsl field.
If you can't change the name of the property, you need to enter the property name in the following format: Original property name: {{properties.name-with-hyphens.value}} New format: {{properties['name-with-hyphens'].value}}
data aggregation
Here you can aggregate the results of the return data.
none: No aggregation, use raw data (for example, when the data provided by the API has already been aggregated in some way due to the type of request).
count: Count how many results are returned (for example, when you return a list of unavailable servers, you can count the results to show how many servers are unavailable).
sum: Show the sum of all results (for example, your return data is a list of tickets in various states and you want to know how many tickets there are in total). For sum, you need numeric values. If your return data contains strings, you need to convert them into a numeric value.
grouping
Here you can define a group to take a closer look at the graph's value(s). Each item in the group will create its own series (a line in a line graph, a bar in a bar graph etc.). For example, if you group the value response time by servers on a line graph, you'll see one line per server, each line showing you the response time for this one server over time.
To enter your grouping, you have to find the property that contains it. You can use the mustache picker to see every property returned from the response data. Pick the property that contains the grouping you want your graph to show.
Note: If you type in the property, make sure you add the mustache {{}} to the property name. Otherwise, you'll either get an error message or the property will be interpreted as a static value and be the same for every result.
Note: If your grouping needs more than one property, you can combine multiple properties. For example, if you want to see the disk space on the c: drive of different computers, your grouping needs to be c: drive and computer. You can combine them in one mustache {{PropertyForComputer + PropertyForC:Drive}} or keep them in separate mustaches {{PropertyForComputer} {PropertyForC:Drive}}.
metrics
Here you define which value the graph will show. For example, if you want to see the response time of different servers, your metric value would be response time. If you want to see the number of tickets, your metric value would be number (of tickets).
To enter your metric value, you have to find the property that contains that value. You can use the mustache picker to see every property returned from the response data. Pick the property that contains the value you want your graph to show
Note: If you type in the property, make sure you add the mustache {{}} to the property name. Otherwise, you'll either get an error message or the property will be interpreted as a static value and be the same for every result.
Note: The metric value must be a numeric object. If an API returns values as strings, you can convert them from a string to a numeric object with the parseFloat() function.
Info: You can manipulate the value by adding operators to add, substract, divide or multiply. You can pick additonal properties from the response data or insert plain text for those functions. For example, if you want to multiply two properties you can do that by entering {{PropertyForMetricValue*PropertyForOtherMetricValue2}} . If you want to change Kb in Gb you can divide the value by 1024: {{PropertyForMetricValue/1024}}. You can also use more elaborate functions according to JavaScript syntax.
Extract multiple metrics:
If you want to see more than one value, you can tick the "Extract multiple metrics" checkbox. You can manipulate those metrics exactly like the first metric you chose. The metrics won't affect each other, they are all treated as separate metrics. Each value will get its own series (a line in a line graph, a bar in a bar graph etc.).
Sort
Sort allows you to change the order of the results displayed. You can sort by value (ascending or descending) or label (alphabetically ascending or descending).
Value formatter
Allows you to format the value by using the mustache picker. For example, you can round the value up or down or convert it.
Display
Size mode:
Default
Displays the donut scaled to the height of the tile.
Fill
Enlarges the donut to use the whole width of the tile. If you chose the fill option and show the legend, you can define the size of the legend with a slider.
Show legend:
Allows you to show or hide the legend of the graph.
Table or Inline:
Show the legend as a separate table or as labels pointing to the segments. When using Inline you can also hide the segment values, and use the slider to change the size of the labels.
Show zero values in legend:
Will show legend items for values of zero which are otherwise missing from the donut.
Fixed height scrollable legend:
Sets the legend to a fixed height where you can scroll through the items. This means that the tile doesn't become too large if there are many items.
Display mode:
Allows you to switch between displaying absolute values or percentages.
Color palette:
Here you can choose between different color palettes.
Note: If there are more items than colors, the colors repeat from the beginning.
Tip for displaying priorities or health states: If you want to display priorities or health states from a data source that doesn't enrich the data with information about priority or health (like the SQL tile or external APIs), use the custom color option and map the results to the correct color. This way, you can make sure that healthy or low priority results are displayed in green, unhealthy or high priority results are displayed in red, etc. If you use the color palettes Priorities, Health1, or Health2 the colors get assigned depending on how the results are sorted, which doesn't guarantee that the colors make sense for the priority or state they represent.
General
10 different colors without specific meaning
Priorities
5 different colors representing 5 different priority states
Health1
3 different colors representing 3 different health states (red=unhealthy, green=healthy, gray=unknown)
Health2
4 different colors representing 4 different health states (red=critical, orange=unhealthy, green=healthy, gray=unknown)
Pastel
10 different pastel colors without specific meaning
Blue
4 different shades of blue from dark to light
Orange
4 different shades of orange from dark to light
Green
4 different shades of green from dark to light
Pink
4 different shades of pink from dark to light
Custom
Setting colors based on values
You can display the data in different colors based on values you define here. For example, you can display the data in green when the value is below 100 and in red when it is above 100.
Click on add to configure a condition.
Click on select color.... to open the color picker. Select the color for this condition.
Enter your condition in the field next to the color. You can use the value property and manipulate it with JavaScript String and Regex APIs. When you click on the mustache picker, you'll get some examples:
Value is greater than something, less than something, etc. For example: {{value < 10}} (The color you pick will be used if the value is less than 10)
Value is present in the result (scalar tiles only) For example: value.IndexOf('error') != -1 (The color you pick will be used if the string value "error" is present in the results)
Value matches one of the regular expressions you defined (scalar tiles only) For example: value.match(/healthy|good|up/) (The color you picked will be used if the string values are healthy, good, or up)
You are able to combine value matching with label matching.
Setting colors based on labels
You can display the data in different colors based on labels. For example, you can display data in green for a specific user.
Click on select color.... to open the color picker. Select the color for this condition.
Enter your condition in the field next to the color. You can use the label property and manipulate it with JavaScript String and Regex APIs. When you click on the mustache picker, you'll get some examples:
Condition is true if the label contains something For example: {{label.indexOf('SQL') != -1}} (The color you pick will be used if the label contains 'SQL')
Condition is true if the label contains multiple things For example: {{label.match(/C:|D:|E:/) != null}} (The color you pick will be used if the label contains 'C:', 'D:' or 'E:')
Condition is true if the label contains multiple things with multiple variations For example: {{label.match(/^[Ss]erver[0-9]+$/) != null}} (The color you pick will be used if the label is 'Server' or 'server' with a number after it)
You are able to combine label matching with value matching.
Data mapping
Here you map the status information from your return data to the states of the status icons or blocks. Since every API returns data in a different format, you need to tell the tile where to find the status information and how to interpret it.
Property names that contain hyphens (for example properties.name-with-hyphens) can't be processed due to a JavaScript limitation. If you want to use a property that contains a hyphen, you have two options:
If you have access to the data source and can change the name of the property, change the name of the property to a name without hyphens. For example, if your Elasticsearch query uses a property (an aggregation, a grouping or any other property you want to use) with a name that contains a hyphen, you can either access your Elasticsearch instance and change the name there or you can overwrite the name in the query dsl field.
If you can't change the name of the property, you need to enter the property name in the following format: Original property name: {{properties.name-with-hyphens.value}} New format: {{properties['name-with-hyphens'].value}}
State property: Here you tell SquaredUp DS where to find the status information in the return data. Use the mustache picker to select the property from your return data that contains the status information, for example {{status}}.
Note: If you type in the property, make sure you add the mustache {{}} to the property name. Otherwise, you'll either get an error message or the property will be interpreted as a static value and be the same for every result.
Defining custom states If your return data doesn't contain a specific state property or you want to use your own categories, you can use JavaScript to define states. This allows you to take your return data and define something like "I want result x (number of open tickets, response time, etc.) to be considered as healthy, otherwise the result should be considered unhealthy."
Defining simple custom states
Use case: Your API returns data with a response time (for example, you monitor servers in Pingdom). You want a response time of over 500 ms to be considered as "Warning", anything else should be considered as "Ok".
{{lastresponsetime >= "500" ? "WARNING" : "OK" }}
Mapping:
Healthy
OK
Warning
WARNING
Result: You'll see yellow blocks or icons when the response time is over 500 ms and green blocks or icons if the response time is below 500 ms. There will be no red icons or blocks since there is no mapping for "Critical". There will also be no gray blocks since there will be no "Unknown" state, because the return data will always be either below or over 500 ms.
Displaying only results of a specific type
Use case: Your API returns data with a type and a priority (for example, tickets in Zendesk). You only want to see high priority cases. You consider a case high priority when the two fields "type: problem" and "priority: normal" apply to the result. All other results should be ignored.
{{#if type == "problem" && priority == "normal"}}HIGHPRIORITY{{else}}IGNORE{{/if}}
Mapping:
Critical
HIGHPRIORITY
The checkbox hide tiles where the state is unknown is activated.
Result: You'll see red blocks for the cases you defined as high priority. You'll see no green, yellow, or gray blocks, since they have not been mapped and unknown states are hidden.
Defining custom states based on multiple conditions
Use case: Your API returns data with a state and a response time (for example, you monitor servers in Pingdom). You want to define states based on those criteria. If the status is "up", you consider it healthy as long as it is below 65 ms response time. If it is "up" and over 65 ms, you want it to be considered as "warning" in SquaredUp DS (yellow block or icon). If the state in the response data is "warning" instead of "up", you also want it to be considered as "warning". If the state is "down", you want it to be "critical" in SquaredUp DS.
Result: You'll see green blocks or icons (Healthy) for results with the status "up" and a response time below 65 ms. If the status is "up" but the response time is above 65 ms, you'll see a yellow block or icon (Warning). If the status in the response data is "warning" instead of "up", you'll also see a yellow block, since you defined this also a yellow and yellow is mapped to Warning. If the status is "down", you'll see a red block (Critical). Any other results that don't fit in the categories you defined will be displayed as a gray block or icon (Unknown).
Tip: Since there are two possible causes for the Warning state, you want to be able to tell if the status or the response time caused the issue. Use a custom label or sublabel that shows you the status and the response time in your status icon or block to be able to see what caused the warning.
Defining custom states with a date and time threshold
Use case: Your API returns data with a date and time, as well as a type and a priority (for example, tickets in Zendesk). You want tickets of type problem with a normal priority to be acknowledged within 30 mins, which is why you want to see tickets older than 30 mins highlighted in yellow and older than 45 mins highlighted in red.
Result: You'll see tickets that have been created today (Date.now()), are older than 30 mins (1800000 ms), and are of the type problem with a normal priority as yellow blocks or icons since you mapped 30MINS to Warning. When those tickets are older than 45 mins (2700000 ms), they'll turn red since they are mapped to critical. All other tickets will be displayed as green blocks or icons because all other tickets fall into the OK category that is mapped to Healthy. There will be no gray (unknown) blocks or icons since all tickets will fall into one of the custom states you defined.
State mapping: Here you tell SquaredUp DS how you want the status information to be interpreted. Map the values of the property from your return data to the states of the status icons or blocks. For example, when the {{status}} property from your return data can have the values good, averageand bad, your mapping would look like this:
Healthy
good
Warning
average
Critical
bad
Any value that is not mapped to a state will be interpreted as unknown. The mapped state values define the color of the status icons or blocks:
Healthy
green
Warning
yellow
Critical
red
Unknown
gray
Link options
item link:
Allows you to turn the graph item(s) into links. You can either enter plain text to create a fixed link (URL always stays the same) or use dynamic properties to create a dynamic link.
Dynamic links make use of dynamic properties which are inserted as part of the URL. This creates a template URL that will be resolved to an actual URL based on the items properties.
For example, if you want to link to tickets in your ticket system and the format of the URL for tickets in your system is https://www.my-system/ticket-123, where 123 is the ticket ID, you can use the dynamic property that contains the ticket ID and enter the dynamic URL https://www.my-system/ticket-{{ticketID}}.
For scalars, you can only use the dynamic property value in dynamic links, which means the link changes when the value of the scalar changes. Since a scalar is just one item, it would also make sense to use a fixed link, for example the link to the website of which you are displaying the response time.
For status icon or bars and the rows of a grid, you usually want to use a dynamic link since you get multiple items or rows that represent different things. You can use any of the dynamic properties the mustache picker offers you.
Dynamic mustache properties and values you need to change according to your instance are highlighted in bold.
Property names that contain hyphens (for example properties.name-with-hyphens) can't be processed due to a JavaScript limitation. If you want to use a property that contains a hyphen, you have two options:
If you have access to the data source and can change the name of the property, change the name of the property to a name without hyphens. For example, if your Elasticsearch query uses a property (an aggregation, a grouping or any other property you want to use) with a name that contains a hyphen, you can either access your Elasticsearch instance and change the name there or you can overwrite the name in the query dsl field.
If you can't change the name of the property, you need to enter the property name in the following format: Original property name: {{properties.name-with-hyphens.value}} New format: {{properties['name-with-hyphens'].value}}
Label
Allows you to change the label of the results.
name
Choose this option if you want to use the default label that has been created automatically.
custom
Here you can change the label to a custom label. You can use static text and dynamic properties. Use the mustache picker to select dynamic properties from the response data to use them as labels.
Property names that contain hyphens (for example properties.name-with-hyphens) can't be processed due to a JavaScript limitation. If you want to use a property that contains a hyphen, you have two options:
If you have access to the data source and can change the name of the property, change the name of the property to a name without hyphens. For example, if your Elasticsearch query uses a property (an aggregation, a grouping or any other property you want to use) with a name that contains a hyphen, you can either access your Elasticsearch instance and change the name there or you can overwrite the name in the query dsl field.
If you can't change the name of the property, you need to enter the property name in the following format: Original property name: {{properties.name-with-hyphens.value}} New format: {{properties['name-with-hyphens'].value}}
Sublabel
Allows you to add a sublabel of the results.
custom
Here you can change the label to a custom label. You can use static text and dynamic properties. Use the mustache picker to select dynamic properties from the response data to use them as labels.
Property names that contain hyphens (for example properties.name-with-hyphens) can't be processed due to a JavaScript limitation. If you want to use a property that contains a hyphen, you have two options:
If you have access to the data source and can change the name of the property, change the name of the property to a name without hyphens. For example, if your Elasticsearch query uses a property (an aggregation, a grouping or any other property you want to use) with a name that contains a hyphen, you can either access your Elasticsearch instance and change the name there or you can overwrite the name in the query dsl field.
If you can't change the name of the property, you need to enter the property name in the following format: Original property name: {{properties.name-with-hyphens.value}} New format: {{properties['name-with-hyphens'].value}}
none
By default, no sublabels are shown.
Sort
Sort allows you to change the order of the results displayed. You can also group them by their characteristics.
default
By default, the sorting of resources depends on the data source. This can be alphabetical sorting or the order in which data comes back from an API request.
sort by
Sort by label or tenant, ascending or descending
group by
Group by label or tenant, ascending or descending
Limit:
Allows you to define a maximum number of resources that will be shown. When 'group by' is used the limit applies to each group individually, for example to show 10 resources in each health state.
Image
Here you can choose one of the provided images or upload your own. Tip: If you want a different selection of maps, you can download more at https://freevectormaps.com/
Supported image formats: png, jpg, jpeg, gif, tif, tiff. svg, bmp Tip: SVG images resize best since they are vector images.
File size limit: 10MB
Image size: Images fill the size of the tile, which means you can resize the image by adjusting the tile's size. The size of the tile also depends on the screen the dashboard is being viewed on.
Icons
Here you can customize the icons on the image:
You can change the size of the icons with the slider
You can change the shape of the icons (square or circle)
You can drag the icons on the image into position
Display styles for Status icons
This setting is not done in a panel, you can change the display style even after you finished configuring the tile.
You can use toggle zoom button at the top right of the tile to change between the different ways Status icons can be displayed.
One long list
Column list
Icons only
Data mapping
Here you map the status information from your return data to the states of the status icons or blocks. Since every API returns data in a different format, you need to tell the tile where to find the status information and how to interpret it.
Property names that contain hyphens (for example properties.name-with-hyphens) can't be processed due to a JavaScript limitation. If you want to use a property that contains a hyphen, you have two options:
If you have access to the data source and can change the name of the property, change the name of the property to a name without hyphens. For example, if your Elasticsearch query uses a property (an aggregation, a grouping or any other property you want to use) with a name that contains a hyphen, you can either access your Elasticsearch instance and change the name there or you can overwrite the name in the query dsl field.
If you can't change the name of the property, you need to enter the property name in the following format: Original property name: {{properties.name-with-hyphens.value}} New format: {{properties['name-with-hyphens'].value}}
State property: Here you tell SquaredUp DS where to find the status information in the return data. Use the mustache picker to select the property from your return data that contains the status information, for example {{status}}.
Note: If you type in the property, make sure you add the mustache {{}} to the property name. Otherwise, you'll either get an error message or the property will be interpreted as a static value and be the same for every result.
Defining custom states If your return data doesn't contain a specific state property or you want to use your own categories, you can use JavaScript to define states. This allows you to take your return data and define something like "I want result x (number of open tickets, response time, etc.) to be considered as healthy, otherwise the result should be considered unhealthy."
Defining simple custom states
Use case: Your API returns data with a response time (for example, you monitor servers in Pingdom). You want a response time of over 500 ms to be considered as "Warning", anything else should be considered as "Ok".
{{lastresponsetime >= "500" ? "WARNING" : "OK" }}
Mapping:
Healthy
OK
Warning
WARNING
Result: You'll see yellow blocks or icons when the response time is over 500 ms and green blocks or icons if the response time is below 500 ms. There will be no red icons or blocks since there is no mapping for "Critical". There will also be no gray blocks since there will be no "Unknown" state, because the return data will always be either below or over 500 ms.
Displaying only results of a specific type
Use case: Your API returns data with a type and a priority (for example, tickets in Zendesk). You only want to see high priority cases. You consider a case high priority when the two fields "type: problem" and "priority: normal" apply to the result. All other results should be ignored.
{{#if type == "problem" && priority == "normal"}}HIGHPRIORITY{{else}}IGNORE{{/if}}
Mapping:
Critical
HIGHPRIORITY
The checkbox hide tiles where the state is unknown is activated.
Result: You'll see red blocks for the cases you defined as high priority. You'll see no green, yellow, or gray blocks, since they have not been mapped and unknown states are hidden.
Defining custom states based on multiple conditions
Use case: Your API returns data with a state and a response time (for example, you monitor servers in Pingdom). You want to define states based on those criteria. If the status is "up", you consider it healthy as long as it is below 65 ms response time. If it is "up" and over 65 ms, you want it to be considered as "warning" in SquaredUp DS (yellow block or icon). If the state in the response data is "warning" instead of "up", you also want it to be considered as "warning". If the state is "down", you want it to be "critical" in SquaredUp DS.
Result: You'll see green blocks or icons (Healthy) for results with the status "up" and a response time below 65 ms. If the status is "up" but the response time is above 65 ms, you'll see a yellow block or icon (Warning). If the status in the response data is "warning" instead of "up", you'll also see a yellow block, since you defined this also a yellow and yellow is mapped to Warning. If the status is "down", you'll see a red block (Critical). Any other results that don't fit in the categories you defined will be displayed as a gray block or icon (Unknown).
Tip: Since there are two possible causes for the Warning state, you want to be able to tell if the status or the response time caused the issue. Use a custom label or sublabel that shows you the status and the response time in your status icon or block to be able to see what caused the warning.
Defining custom states with a date and time threshold
Use case: Your API returns data with a date and time, as well as a type and a priority (for example, tickets in Zendesk). You want tickets of type problem with a normal priority to be acknowledged within 30 mins, which is why you want to see tickets older than 30 mins highlighted in yellow and older than 45 mins highlighted in red.
Result: You'll see tickets that have been created today (Date.now()), are older than 30 mins (1800000 ms), and are of the type problem with a normal priority as yellow blocks or icons since you mapped 30MINS to Warning. When those tickets are older than 45 mins (2700000 ms), they'll turn red since they are mapped to critical. All other tickets will be displayed as green blocks or icons because all other tickets fall into the OK category that is mapped to Healthy. There will be no gray (unknown) blocks or icons since all tickets will fall into one of the custom states you defined.
State mapping: Here you tell SquaredUp DS how you want the status information to be interpreted. Map the values of the property from your return data to the states of the status icons or blocks. For example, when the {{status}} property from your return data can have the values good, averageand bad, your mapping would look like this:
Healthy
good
Warning
average
Critical
bad
Any value that is not mapped to a state will be interpreted as unknown. The mapped state values define the color of the status icons or blocks:
Healthy
green
Warning
yellow
Critical
red
Unknown
gray
Link options
item link:
Allows you to turn the graph item(s) into links. You can either enter plain text to create a fixed link (URL always stays the same) or use dynamic properties to create a dynamic link.
Dynamic links make use of dynamic properties which are inserted as part of the URL. This creates a template URL that will be resolved to an actual URL based on the items properties.
For example, if you want to link to tickets in your ticket system and the format of the URL for tickets in your system is https://www.my-system/ticket-123, where 123 is the ticket ID, you can use the dynamic property that contains the ticket ID and enter the dynamic URL https://www.my-system/ticket-{{ticketID}}.
For scalars, you can only use the dynamic property value in dynamic links, which means the link changes when the value of the scalar changes. Since a scalar is just one item, it would also make sense to use a fixed link, for example the link to the website of which you are displaying the response time.
For status icon or bars and the rows of a grid, you usually want to use a dynamic link since you get multiple items or rows that represent different things. You can use any of the dynamic properties the mustache picker offers you.
Dynamic mustache properties and values you need to change according to your instance are highlighted in bold.
Property names that contain hyphens (for example properties.name-with-hyphens) can't be processed due to a JavaScript limitation. If you want to use a property that contains a hyphen, you have two options:
If you have access to the data source and can change the name of the property, change the name of the property to a name without hyphens. For example, if your Elasticsearch query uses a property (an aggregation, a grouping or any other property you want to use) with a name that contains a hyphen, you can either access your Elasticsearch instance and change the name there or you can overwrite the name in the query dsl field.
If you can't change the name of the property, you need to enter the property name in the following format: Original property name: {{properties.name-with-hyphens.value}} New format: {{properties['name-with-hyphens'].value}}
Label
Allows you to change the label of the results.
name
Choose this option if you want to use the default label that has been created automatically.
custom
Here you can change the label to a custom label. You can use static text and dynamic properties. Use the mustache picker to select dynamic properties from the response data to use them as labels.
Property names that contain hyphens (for example properties.name-with-hyphens) can't be processed due to a JavaScript limitation. If you want to use a property that contains a hyphen, you have two options:
If you have access to the data source and can change the name of the property, change the name of the property to a name without hyphens. For example, if your Elasticsearch query uses a property (an aggregation, a grouping or any other property you want to use) with a name that contains a hyphen, you can either access your Elasticsearch instance and change the name there or you can overwrite the name in the query dsl field.
If you can't change the name of the property, you need to enter the property name in the following format: Original property name: {{properties.name-with-hyphens.value}} New format: {{properties['name-with-hyphens'].value}}
Sublabel
Allows you to add a sublabel of the results.
custom
Here you can change the label to a custom label. You can use static text and dynamic properties. Use the mustache picker to select dynamic properties from the response data to use them as labels.
Property names that contain hyphens (for example properties.name-with-hyphens) can't be processed due to a JavaScript limitation. If you want to use a property that contains a hyphen, you have two options:
If you have access to the data source and can change the name of the property, change the name of the property to a name without hyphens. For example, if your Elasticsearch query uses a property (an aggregation, a grouping or any other property you want to use) with a name that contains a hyphen, you can either access your Elasticsearch instance and change the name there or you can overwrite the name in the query dsl field.
If you can't change the name of the property, you need to enter the property name in the following format: Original property name: {{properties.name-with-hyphens.value}} New format: {{properties['name-with-hyphens'].value}}
none
By default, no sublabels are shown.
Sort
Sort allows you to change the order of the results displayed. You can also group them by their characteristics.
default
By default, the sorting of resources depends on the data source. This can be alphabetical sorting or the order in which data comes back from an API request.
sort by
Sort by label or tenant, ascending or descending
group by
Group by label or tenant, ascending or descending
Limit:
Allows you to define a maximum number of resources that will be shown. When 'group by' is used the limit applies to each group individually, for example to show 10 resources in each health state.
Blocks
Here you can set the number of columns for the blocks, their height and the font size within the blocks.
Click done to save the tile.
The tile now shows data according to your settings.


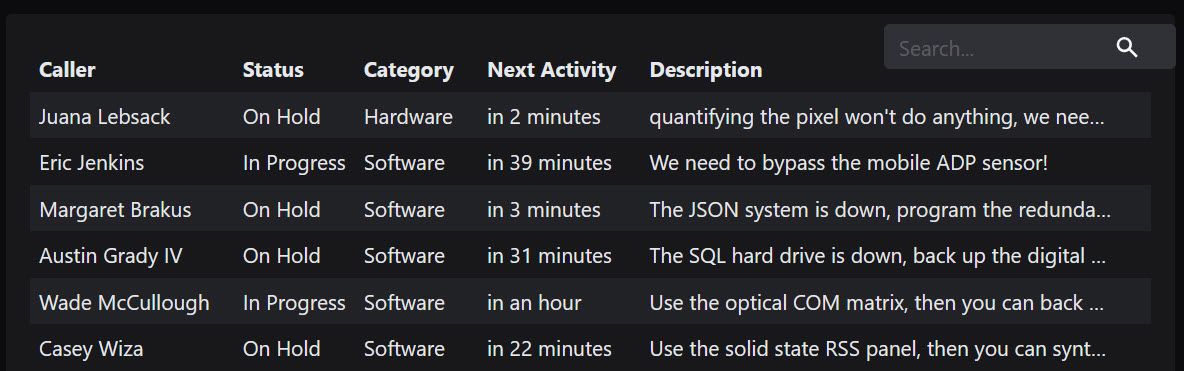


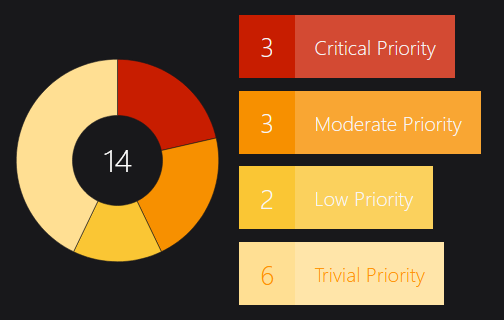


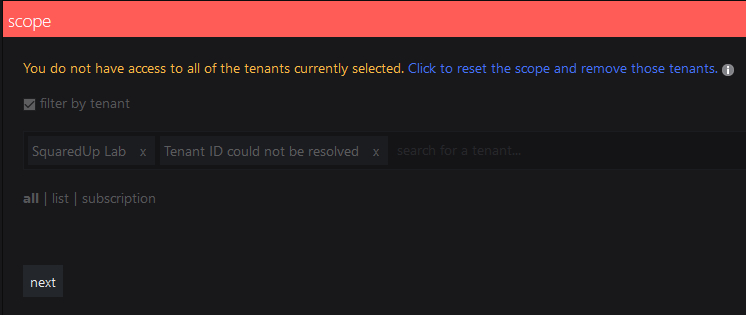


 One long list
 Column list
 Icons only
