Add the following information to the boxes as shown below: First box (name): authorization Second box (value): Token token=API token from PagerDuty
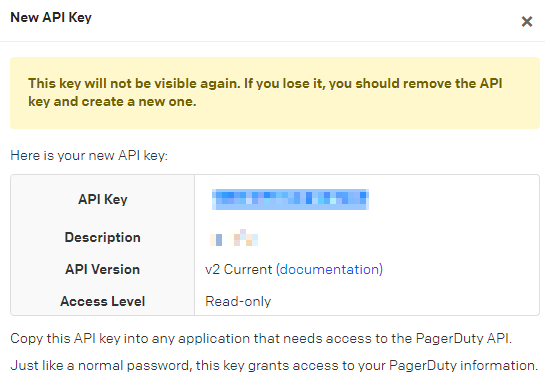
You can create an API access key (token) by logging in to PagerDuty > Integrations > API Access Keys > Create New API Key, and ticking Read-only API Key. See Generating API Keys
Copy the API access key from PagerDuty before closing the window:
Paste into the authorization value box in SquaredUp DS, prepended by Token token= as shown above.
It is important to use http GET mode and to set the key path in the response data section to alerts. This is described in the steps below.
On the top navigation bar in SquaredUp DS click the + to create a new dashboard, and give your dashboard a title.
Select any page template, for example the two tile layout, and then click Configure tile to begin.
Click on Integrations > Web API.
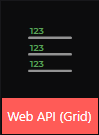
Select Web API (Grid).
Leave the scope section blank for this walkthrough.
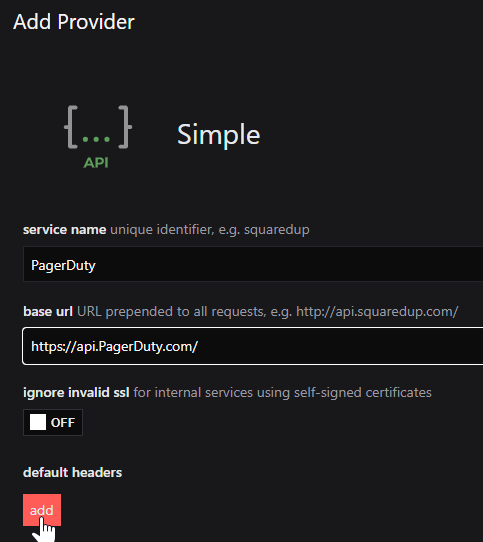
In the provider section select the PagerDuty provider that you created earlier.
In the http mode section leave the http method set to GET.
Type alerts in the box after the URL. The URL shown here is the URL you specified when you created the PagerDuty Web API provider. At this point you should see a table, but it won't show data quite yet.
Leave the headers & data section as it is for this walkthrough.
In the response data section you should see some data in the response data box. If there isn't any data check the configuration of your provider.
Type alerts into the key path box. At this point the table should change to show data:
Click next to move to the grid columns section.
Click hide next to some of the columns you might not wish to show, e.g. id, type, summary, self, html_url, resolved_at, alert_key, suppressed, service, incident, first_trigger_log_entry, body, integration, privilege.
You may like to rename the columns to make them more readable, e.g. created_at to Created, status to Status and severity to Severity
To make the created date and time more readable you can use mustache syntax with timeago (How to use Custom Labels) in the custom template. Click edit next to Created and paste the following in to the custom template box: {{timeago(value)}} This shows how long ago the alert occurred. You may like to add further columns for additional data. For help customizing the columns of data see How to use the Grid Designer.
You can also add columns. Click Add, give the column a name, such as Message, and in the custom template box. Leave data key path empty. Click the mustache helper button and select the value you require. You can also type in the box to find the value you want. For example {{value.body.cef_details.message}} then click done:
Other columns you might like to add include: name: Website with custom template: {{value.body.cef_details.details.hostname}} name: Related Incident with custom template: {{value.incident.summary}}
You may wish to change the order the columns by dragging them into position.
The Grid Options Row Link property allows you to automatically link each row to a parameterised hyperlink. Click on the mustache helper button and then select {{incident.html_url}} from the drop down list.
It is important to use http GET mode and to set the key path in the response data section to incidents.
Click on the Web API tile.
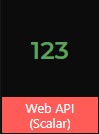
Select Web API (Scalar).
Leave the scope section blank for this walkthrough.
In the provider section select the PagerDuty provider that you created earlier.
In the http mode section leave the http method set to get.
In the box following the URL you need to type incidents After clicking elsewhere on the dashboard the results pane should change from an API error to No scalar data found at keypath.
The headers & data section is where you can pass key variables through to PagerDuty. Click the add button under data to add the following data name and value settings: name: statuses%5B%5D value: resolved
Click apply changes.
In the response data section you should see some sample data shown. Type incidents into the key path field. When you click outside the box the No scalar data found at keypath message will change to show a value.
Click next to move to the scalar section where you can change the font size if you wish.
Click done.
Repeat the above steps to create two new tiles, one for Triggered and another for Acknowledged substituting the following data name and value settings in lower case in the headers & data section: name: statuses%5B%5D value: triggered name: statuses%5B%5D value: acknowledged