What's New in SquaredUp DS for Azure
SquaredUp DS for Azure came to its end-of-life on 26th September 2024 and is no longer maintained. Existing customers can still renew and support will continue until further notice.
We recommend that you sign up to SquaredUp Cloud. If you have yet to sign up, create a free account here and find out more here.
What's New in v5.7
SquaredUp DS for Azure v5.7 includes the following new features:
- Timeframes – major enhancements
- Line Graph tile – major enhancements
- Recycle Bin
- Many more enhancements
Timeframes – Major Enhancements
A much-requested set of improvements bring new control over the dashboard and tile timeframes. Choose a very specific date/time range on a Performance tile, or perform some analysis on your alerts by looking at various time ranges. These are some of the use cases that the timeframe improvements now enable. Specifically:
- A greater range of dashboard timeframes
- A calendar picker on Performance tiles
- User-friendly date/time picker in Connect tiles to inherit dashboard timeframes e.g. to insert in a Web API header, or within a PowerShell or SQL script.
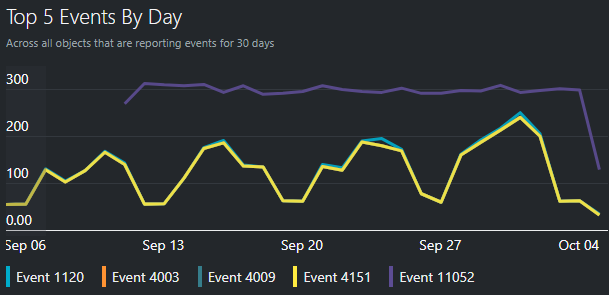
Line Graph tile – Major Enhancements
Several improvements aim to strengthen the capabilities of Line Graphs. Display a threshold line and a red area of concern to quickly spot out-of-bound metrics. The x-axis now draws future dates as well as up to the last datetime point.
See How to use the Performance tile
Recycle Bin
Any deleted dashboards and perspectives now end up in the new Recycle Bin. An administrator can see who deleted dashboards and perspectives and when, then take action: restore or permanently delete.
See Recycle Bin
Many more enhancements
- Sparkline color matching
- Each user's last login time on the Named User list
- Improvements to Alert tile date columns
- Donut legend is optionally scrollable to fix tile height
- and more...
See Release Notes for SquaredUp DS for Azure
Download now & more information
To get started see How to install SquaredUp DS for Azure using the installer
Get the latest version of SquaredUp DS for Azure
Read the Release Notes for SquaredUp DS for Azure for details on other improvements in this release.
If you have an earlier version of DS for Azure already installed, then the installer will upgrade your installation, see How to upgrade SquaredUp DS for Azure
What's New in v5.6
SquaredUp DS for Azure v5.6 includes the following new features:
- Option to limit the number of objects returned (Top n) in the Status tile
- Option to wrap sub-label in the Status tile
- Allow API query parameters to be set at provider level
See Release Notes for SquaredUp DS for Azure
What's New in v5.5
SquaredUp DS for Azure v5.5 includes the following new features:
- Adjustable dashboard refresh interval
- Many more enhancements
Adjustable dashboard refresh interval
A new dashboard setting lets you set the refresh interval for a given dashboard and its Open Access version. Whether you need to reduce the load on your external data, or an API comes with an access cost, you can increase the refresh interval in increments, up to 6 hours. You can also decrease the interval down to 30 seconds on any given dashboard if you need to see the data more often.
See How to create a dashboard - Dashboard Settings
Many more enhancements
- Switch visualizations whilst retaining some tile configuration
- Format value on a Bar Graph tile with the mustache formatter
- Set Open Access theme to light or dark mode per dashboard see Dark and Light Theme Setting
- Disable interaction in Open Access per dashboard see Interaction Setting
- And much more, see Release Notes for SquaredUp DS for Azure
What's New in v5.4
SquaredUp DS for Azure v5.4 includes the following new features:
- New visualization: Surface tile
- New data source: ODBC
- Updated Grid tile: major enhancements
New visualization: Surface tile
Overlay your most important Azure metrics over any image background (e.g. a world map, an architecture diagram, a picture from your diagramming tool like Visio). Unleash your creativity and share stunning dashboards with your operation centers and stakeholders or display them on wall screens across your organization. Check out the 5.4 release webinar for inspiration!
See How to use the Surface tile.
New data source: ODBC
The new ODBC data source lets you instantly visualize any data from virtually any database. From Oracle, PostGre, MySQL to many more, you can now dashboard your most important metrics directly from your ODBC databases using a dynamic SQL query.
Updated Grid tile: major enhancements
Unlock your grid tiles! Breeze through your logs and alerts with the ability to sort, search and filter. Optimise the look of your dashboard tables for any screens by setting the zoom/font size, column width and improved text wrap. Available for any Grid tiles including Azure Monitor Alerts.
For example see How to use the Web API tile
What's New in v5.3
SquaredUp DS for Azure v5.3 includes the following new features:
- Community Dashboards: Sharing and Importing
- New visualization: Status Image
- Default dashboard timeframe
- Scalar: conditional colors
- Donut: display improvements
Community Dashboards: Sharing and Importing
The Community Dashboards website has been completely redesigned to include any dashboard submitted by our community. Check out some of our most popular dashboards (VMWare, Azure DevOps, and more) and import them directly in your own instance of SquaredUp DS for Azure.
Be a community hero! Export your own dashboards to our community using the new one-click export.
See Dashboard Packs
New visualization: Status Image
Visualize the status of what’s important to you, pinpoint a problem more quickly and accurately, and share your complex metrics into simple and compelling dashboards for your stakeholders. Thanks to the new Status Image visualization, you can overlay status icons from any external data sources on top of any images of your choice (e.g. a world map, a data center layout, a picture from your diagramming tool like Visio). Statuses can be retrieved and calculated from any data sources (Web API, PowerShell script, Splunk, Elasticsearch, etc) thanks to our intuitive tile designer.
Default dashboard timeframe
Set the default timeframe of your dashboard so that you and anyone you have shared the dashboard with Open Access can always see the dashboard in its most relevant light depending on its purpose and target audience. Set it to 30 days or longer for an application SLA dashboard shared with your stakeholders, or 1 hour for your root cause analysis dashboard. Timeframes range from 1 hour to 12 months.
Scalar: conditional colors
Add impact to your key metrics with conditional colors for scalar visualizations. Available for any Azure metrics or data point from your external data sources. Use the intuitive logic builder to create custom conditions that will trigger your scalar visualization to change color. Choose from a range of colors with the option to highlight the background or the text. Also added support for web links so you can drill out to the corresponding tool to see more details about your metric.
Donut: display improvements
Include the ability to map a specific color to a specific segment/legend of the donut, show as percentage and sorting by value or legend. Note: Status tiles only support sorting, Alert and ServiceNow tiles only support percentage.
What's New in v5.2
SquaredUp DS for Azure v5.2 includes the following new features:
- PowerShell tile enhancements
- New visualizations for Splunk
- Public GitHub Samples repository
- Various security improvements
PowerShell enhancements
The hugely popular PowerShell visualization tiles have been enhanced in this release to provide script execution controls and security configuration:
• Create your own Run As accounts for improved security.
• Configure script execution interval to independently control the load on your external data sources.
• All visualization scripts now run inside their own child process for increased robustness, with the ability to choose the execution environment (.NET Framework or .NET Core) for each script independently depending on the version of PowerShell your script is written.
See How to use the PowerShell tile
New Splunk visualizations
The Splunk tile now includes a full range of visualizations: Bar Graph, Donut, Line Graph, Scalar, Sparklines, Grid, Status Icons and Blocks.
See How to use the Splunk tile
GitHub Samples
A new public GitHub repository has been published, that contains sample dashboards and scripts, is now available and accessible from within the SquaredUp DS application. The GitHub repository is opened to contributions from the community. Browse the repository for dashboard ideas and various scripts to help you make the most of SquaredUp DS. From SolarWinds and Log Analytics dashboards to purpose-built SQL and PowerShell scripts, be sure to take a look at the growing list of samples and contribute your own creations!
Security Improvements
A number of security improvements have been made in this release, following our regular independent security review and penetration test. Best practices for secure deployment of SquaredUp DS have been updated.
See Best Practices for Security.
What's New in v5.1
SquaredUp DS for Azure v5.1 includes the following new features:
- Two new data integrations: Splunk and Elasticsearch
- PowerShell tile: visualize any metrics
- Status visualizations for external data sources
- New visualizations for the SQL tile
New data integrations: Splunk and Elasticsearch
The new Splunk and Elasticsearch data integrations provide a consistent dashboarding experience to pro-actively visualize your log data. An intuitive point-and-click configuration wizard lets you import and visualize your saved queries from Splunk or Elasticsearch. Paste any query or write your own query in the Query DSL or SPL language. Queries support contextual variables so you can visualize your Splunk or Elasticsearch data dynamically on Azure perspectives.
See How to use the Elasticsearch tile and How to use the Splunk tile
New PowerShell tile to visualize any metrics
Available sample, with no separate configuration required, PowerShell visualizations let you connect to any data sources, display any metrics or build custom metrics on the fly. PowerShell scripting is incredibly powerful, and the possibilities in SquaredUp DS are endless (e.g. correlate and aggregate results from multiple APIs, visualize local log files, and more!).
Leverage PowerShell modules to visualize performance metrics that are not easily available via an API (e.g. VMWare). Create your own profiles to store any PowerShell script that you want to execute across different tiles as the first part of your script, such as connection scripts to 3rd party tools, or to load a PowerShell module.
See How to use the PowerShell tile
New status visualizations for external data sources
Beautiful status visualizations provide an at-a-glance view of your most essential metrics to help turn complex metrics into easy to consume dashboards for stakeholders. The new status visualizations are available for most data sources (e.g. Web API, PowerShell, SQL, Log Analytics, Splunk, Elasticsearch). They are configurable both in terms of look and feel (e.g. blocks/list, dynamic labels, etc) and logic. Use the status logic to easily map a status field from your data source, combine multiple values from your data sources, and add custom calculations to generate your own statuses. Click to drill out to the corresponding object in your external tool.
New visualizations for the SQL tile
The SQL tile now includes the full suite of visualizations: Bar Graph, Donut, Line Graph, Scalar, Sparklines, Grid, Status Icons and Blocks.
What's New in v5.0
SquaredUp DS for Azure v5.0 includes the following new features:
- Major overhaul of the dashboard designer experience
- New Open Access
- Improved Web API visualizations and configuration
- Refreshed visual experience
Major overhaul of the dashboard designer experience
Take real control of your layouts, creating rich dashboards easily. Use the new pre-built templates to quickly add a layout, which you can adjust as required. New controls to easily add rows and tiles anywhere on the dashboard. Add new columns to the right or left which will scale the width of the tiles evenly. Split a tile in two to create a nested layout. Other improvements include the ability to drag & drop tiles more easily and better vertical resizing.
How to use the dashboard designer (v5)
New Open Access
Open Access shared dashboards now include simplified interactivity. You can now drill down to access more information with a named user license. Open Access dashboards work seamlessly on all devices, including mobile. Major improvements to the reliability of Open Access including self-healing capabilities and improved scaling and performance.
Sharing Dashboards with anyone - Open Access
Improved Web API visualizations and configuration
Add more context to SCOM dashboards with our new Web API visualizations for your external data sources. New visualizations include the bar chart, donut, line graphs and sparklines. New configuration options include the ability to see the response data, mustache picker options and data mapping capabilities for the new visualizations.
Refreshed visual experience
Better color contrasts in your visualizations, a new range of vibrant heatmap colors, a darker dark mode, and a more modern feel all round.
Internet Explorer is no longer supported.
What's New in v4.8
SquaredUp DS for Azure v4.8 includes the following new features:
- New SQL Line Graph tile
- New Scalar tile to show the latest performance data figure
- New scalable metric labels for Performance metrics
- Line colors can be matched across Performance graphs
- Option to use colored Bar Top N graphs and match colors
New SQL Line Graph tile
A new SQL visualization allows you to display the results of a SQL query as a Line Graph.
A useful addition to the existing Scalar and Grid tiles, the new Line Graph tile is a great way to graph SQL data into one dashboarding experience from your SQL databases or the SCOM Data Warehouse.
Supports all SQL data types, connection strings, value columns selector and miscellaneous SQL capabilities (e.g. stored procedures, temporary tables).
New Scalar tile for performance data
This new performance visualization shows the most recent value for the selected metric. The font size and units can be changed and the figure can be rounded up or down using the mustache picker.
See How to use the Performance tile
New scalable metric labels for Performance metrics
When configuring a Performance tile, the metric label (e.g. percent, bytes, seconds) is automatically added next to the metric value. A new option provides the ability to enter a custom metric label.
The metric label will show on the Y axis and when hovering on a Line graph or Report tile.
The metric label will show next to the metric value on Sparklines and Bar Top N tiles.
See How to use the Performance tile
Match line colors across Performance graphs
The same line color is now used for each matching object across Performance graphs on a dashboard, when the object labels match.
Great with Open Access dashboards on wall-screens and for enterprise applications where you are focusing on a smaller number of similar objects across metrics.
Color matching is on by default, but can be toggled off per dashboard.
How to enable graph color matching
Colored Bar Top N graphs
A toggle option on the Bar Top N graphs will now apply a different color for each bar.
The toggle is off by default but when turned on, the bar colors will match other Performance Graphs’ line colors if the label names are matching.
How to enable graph color matching
What's New in v4.7
SquaredUp DS for Azure v4.7 includes the following new features:
- Cost Utilization Treemap
- Azure Log Analytics enhancements
- Resource Summary tiles
- Scoping by Tenants with Azure Lighthouse
- Search for more results
- Enhanced error handling
Cost Utilization Treemap
The new Cost Utilization Treemap visualization can be used to expose underutilized resources that are costing money in Azure. It is now possible to easily identify overspending by comparing cost with performance metrics in one visualization, then drill down into the resource for more detailed analysis.
See How to use the Cost Management tile
Azure Log Analytics enhancements
Azure Log Analytics tile enhancements:
- A new bar graph visualization
- Quickly access and use your Saved KQL Queries from the Azure Portal
- Combine multiple values into the Line Graph visualization for a resource
See How to use the Azure Log Analytics tile
Resource Summary Tiles
Brand-new Resource Summary tiles provide simple and clear visualizations to give an at a glance view of how many resources of each type, in any scope you choose, for example by tenant, subscription or resource group.
See How to use the Resources tile
Scoping by Tenant(s)
Dashboard tiles can now be scoped to a tenant or multiple tenants with Azure Lighthouse. Easily create a dashboard of information that covers one specific tenant in a multi-tenant scenario or dashboard that compares tenants.
Other new features
- "Show more" search results in the quick search pane.
- Enhanced error handling to no longer show hard to understand errors in published dashboards.
What's New in v4.6
SquaredUp DS for Azure v4.6 includes the following new features:
- Cost Management tile insights
- Support for Azure Lighthouse
- Open Access theme setting
- Dashboard pack upgrades
- Enhanced installation experience
Cost Management Insights
Gain deeper insights into your Microsoft Azure spend with our updated Cost visualization tiles. Building upon the great new Cost Management tiles added in the previous release, you can now find out which resources are costing the most by rolling over the subscription and resource group segments in the Sunburst, and with the new drill down functionality the perspective for that segment is only ever one click away!
As well as enhancing the Cost tiles, version 4.6 also brings changes to the sample dashboards; this release includes an all new Cost Overview dashboard and the Subscriptions Overview has been updated to now include Cost Management tiles.
See How to use the Cost Management tile for more information.
Support for Azure Lighthouse
SquaredUp DS for Azure has been fully tested with Azure Lighthouse and is fully compatible.
Azure Lighthouse provides centralized management capabilities for service providers and enterprise IT organizations across multiple tenants.
See Azure Lighthouse
Open Access theme setting
It is now possible to choose which theme (light or dark) is used for Open Access dashboards. This setting is independent of users’ personal settings.
See Sharing Dashboards with anyone - Open Access
Dashboard Pack upgrades
Upgrading from the previous version will now automatically install updates to the SquaredUp DS Dashboard Packs; new and updated dashboards will be installed, if your installed dashboards have been modified in any way which conflicts with the latest release then you will be able to retain your changes easily.
See Dashboard Packs and How to upgrade SquaredUp DS for Azure
What's New in v4.5
SquaredUp DS for Azure v4.5 brings five new major features:
- Cost Management tile - Line Graph Tree Map and Sun Burst visualizations
- Log Analytics visualizations
- Alert donut and drilldown
- Performance tile improvements including Heatmap and dimensions
- Export to Excel
Cost Management tile
Create new Cost tiles to enhance your ability to see what you are spending the most on in Azure across different levels, like resource groups, subscriptions, and resource types. You can identify cost increases over time with SquaredUp DS's line graphs, or determine areas of cost with the tree map and sun burst visualizations.
See How to use the Cost Management tile for more information.
Log Analytics visualizations
You can now use line graphs and donuts in the Azure Log Analytics tile to provide enhanced visualizations of Azure Monitor Logs, as well as showing log data as either a scalar number or in grid tabular form.
See How to use the Azure Log Analytics tile
Alerts donuts and drilldowns
DS for Azure version 4.5 includes a new Alerts donut tile to summarise alerts for different scopes by severity, resolved state etc - with drilldowns to underlying alert information.
See How to use the Alerts tile
Performance tile enhancements
We have now added a heatmap visualization so you can quickly identify problems across a set of resources. This allows you to split metrics by dimensions – so, for example, you can show availability for each test or each location for any app monitored by AppInsights.
See How to use the Performance tile
Export to Excel
Export the data from your whole dashboard to Excel for further analysis or sharing.
See Export to Excel